

Influence of solar activity on soil (II)
In the previous copies we have frequently mentioned the period of solar activity of 11 years. We have already said that the development period of blacks can be considered 22 years, due to the investment in magnetic polarity of blacks in successive cycles of 11 years. Therefore, somehow we could consider the Sun as a variable, magnetically variable star. However, measurements made by the ACRIM (Active Cavity Radiometer Irradiance Monitor) tool, mounted on the Solar Maximum Mission satellite, have led us to confirm the suspicion of a more global variability.
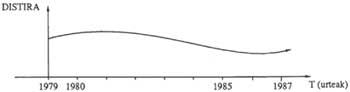
It is evident that the Sun is not a variable star of the type “cefeida” (which usually has large variations of luminosity), but the ACRIM, which measures the emission of energy, has shown that the brightness of the Sun is not constant either. The Solar Maximum Mission (SMM) satellite was launched in the early 1980s to study the last maximum solar activity (1979-1980). Therefore, the data collected are still scarce (first analysis of the same R. Willson and H. It was published by Hudson in Nature in April last year), but of great importance. According to the study, while the Sun has evolved from the aforementioned maximum to the minimum of 1985-6 years, its luminosity has also decreased.
Then, as can be seen in Figure 1, it seems that the emission has begun to increase with the cycle of activity, but it is still too early, according to the data analyzed, to affirm that the evolution is the same as that of the cycle of blacks. And if so, you should measure the percentage of energy increase to detect whether it is the same or there are long trends to the previous reduction.
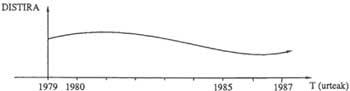
The reduction mentioned above is, as it could not be otherwise, very small, around one thousandth of the electromagnetic emission, but it cannot be rejected. According to climatologists, this decrease, if maintained, may be enough to change the particularities of time. As a comparison we will say: The 1% decrease in solar emission would mean a 1.5°C decrease in average temperature throughout the Earth year, extending winters or even appearing in regions that currently do not know long periods of cold.
It can be said the same, but with opposite effects, of course, the increase in radiation. So droughts would be the main peculiarities. As we shall see, these calculations are not just speculation. There are studies that relate the Earth's climate to the fluctuations of the Sun, although the relationships cause effect are still unknown.
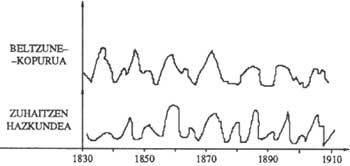
Figures 2 and 3 show two of these relationships. Although factors that may influence the price of wheat may differ, Figure 2 shows a certain relationship between it and the number of annual Sun squids of the same period. This relationship is given by time. The relationship is much more evident between the growth of the trees in Figure 3 and the graphs of the number of blackheads. As we can see, the peaks presented by the growth curve are related to the maximum and minimum numbers of blackheads, but they are much higher (higher growth) in the case of the first ones. The relationship is also due in this case to the weather and specifically to the rainfall represented in Figure 4.
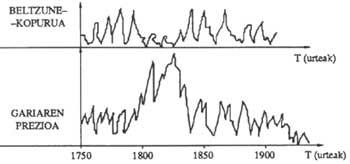
Figure 4 shows two curves: at the bottom, the average number of black spots observable in each year throughout the eleven cycles from 1803 to 1943; at the top, adjusted to the same periods of eleven years, the average in millimeters of the amount of rainfall measured in summer of each year. As in the previous case, we have two maximums per cycle (remember that in the figure the average cycle is represented with the measurements made between 1803 and 1943): one, the smallest, together with the year of minimum number of blackheads per cycle, and the other, the largest, coinciding with the year of maximum number of blackheads per cycle.
This is not the only conclusion we can draw from the study of trees. As is known, trees start every year and what is generated each year appears in the thickness of the ring. Growth depends, logically, on many variables, such as the richness of the earth and the ability to store water, the orientation towards the Sun and the height of the place. However, C. W. Stockton and D. Meko published in 1976 a work based on the study of the rings of trees of long life, including the sequoias. The conclusion of the study is the relationship between western United States droughts and the 22-year magnetic cycle of the Sun. The periods analyzed are from 1700 and the study reveals that droughts are more frequent in three or four years of maximum activity.
Another work (published at the same time, J. A. de Eddy) based on the study of tree rings. In this case the thickness of the rings is not measured, but the carbon content 14 of each of them. As is known, carbon 14 is a radioactive isotope of common carbon that forms at high altitudes in the atmosphere when cosmic rays break nitrogen atoms. Carbon 14 atoms fall to the surface and are absorbed by trees. Therefore, the content of each ring is a function of the Solar Activity of that year. In times of high activity the magnetic field spreads a lot, so it blocks the cosmic rays decreasing the result of the aforementioned isotope.
Therefore, at higher carbon 14, we can talk about a year of lower activity. This reasoning is fully confirmed when an analysis of the period between 1645 and 1715 is carried out. This period is known as the Maunder minimum, because at this time solar activity was abnormally low, with hardly any black appearance. During all these years a very high level of carbon 14 has been detected.
The decline in Maunder minimum activity has also been confirmed by other ways. For example, the number of red wipes registered in this period is minimal. Moreover, those who analyzed the total eclipses of Sun that occurred in those years never realized the structure of the crown. Therefore, it is logical to think that due to the slow activity of the Sun had been reduced to its minimum. On the other hand, the Maunder minimum coincides in time with a cold time in Europe. This season, known as “Little Ice Age”, glaciers also advanced.
As already mentioned, there is no lack of examples that relate the activity of the Sun to the variations of the climate. Scarcity is in terms of concrete data, and that is the gap that is wanted to cover in some years for future studies with the help of SMS.
Buletina
Bidali zure helbide elektronikoa eta jaso asteroko buletina zure sarrera-ontzian