

Logical diagrams (I)
Throughout the history of mathematics images have proved very useful for mathematicians. From the numbers have been represented straight, planes, space, ellipses, circles, cones, paraboloids, sine and cosine functions, exponentials, functions of two, three and four variables, complex functions and a thousand other things that exist in the world of mathematics. Moreover, they have been used both to represent things and to demonstrate some properties, rudders and theorems.
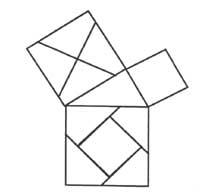
As an example, we would cite some cases: Our myth, legend or story about the death of Archimedes. BC. In 212, when the eromatic soldiers took with arms the city of Syracuse, when Archimedes was part of a geometric demonstration, he was killed by a sword. (Remember that at that time the images were made in sand). But without being so tragic, there is the demonstration through images of the Pythagorean theorem (Figure 1). Finally M. This is an article by master Willians in which, with the help of tangram, some mathematical proofs of Euklides appear.
But in this line mathematicians have gone further and have not remained in the representations of these well-known concepts. Their courage has gone further and they have come to imagine language, idea, reasoning itself. By logic, mathematics and philosophy come together. In this article we will talk about the representation of logic.
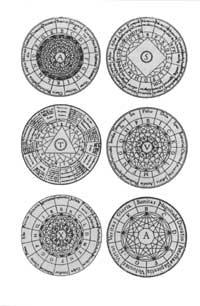
One of the pioneers in the representation of reasoning is the Catalan Ramón Llull. In his masterpiece Ars Magna wanted to explain any subject through systems of concentric circles. Among others (figure 2), God (A,A) and the quality of the soul (S), the relationship between things (T), seven virtues and seven sins (V) or lie and truth (X). Llull got all possible combinations by moving circles.
After this special mention and forgetting other pioneers, we will describe the first system used in the history of logic analysis. This is only the Venn diagram. Venn diagrams have been used in set theory which, within modern mathematics, is a basic theme. In addition, it has served to solve the problems of classical logic inherited from Greek Aristotle and the concept of syllogism.
Undoubtedly, the appearance of the definition of class algebra of Boole had a great influence on the success obtained by the Venn diagrams.
Let's start by applying the basic rules for a proper functioning of the diagrams:
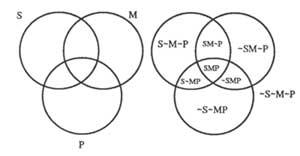
– Each of the circles will represent a class; the points within the circle will be classes and the exteriors will be class no. If the class is S for no S we write &S. Figure 3 shows a three-class diagram.
– To indicate that there are no elements in a class, we will darken. We will indicate that there is some element with an X. If the elements can be in two contiguous zones, we will note X at the limit.
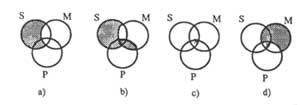
Figure 4 shows the following premises diagrams

From diagram 4b) it follows that: “No S is P.”
“There is S M” (4c) (X is at the limit because we don’t know where the elements are in one, another or both).
If the second premise was “M gold P is”, we should write in X medium: 4d).
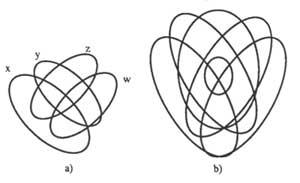
When more than three issues appear, it becomes complicated. Circles must be replaced by ellipses, 5 a) and sometimes by unconnected images 5b).
It can also be used in the proposal calculation created as an interpretation of the class calculation. For this it is necessary to modify the rules dictated and give it a new interpretation. Now the circles represent the proposals. These can be true or false. Before we darkened the regions without elements. Now they also darken to express impossible combinations of values. Figure 6 shows four circles: large (A, B and C) corresponding to propositions and small (not A or B or C, &A&B&C) to indicate the outer face of propositions A, B and C and facilitate darkness.
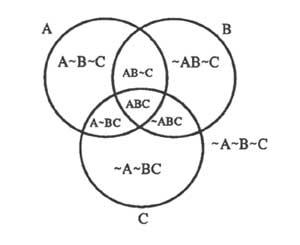
Figure 7 shows some examples:
7a) “A is true”; 7b) “A is false” (or “&A is true”).
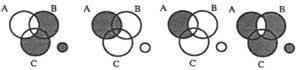
The conditional diagram “If A is true B is true”, is written A … B. The plan under this relationship is CE, EF, FE and FF (True, False), of which only EF is invalid. Therefore, regions with A&B (A, no B) should be darkened as shown in diagram 7 c), i.e. the diagram corresponding to the proposal “A gold B da”. If to the previous proposal we add the proposition “A is true”, that is, we obscure &A, we will obtain the diagram of figure 7d) and as a conclusion we obtain “B is true”.
In figure 7b) it can be observed that falsehood A does not imply that the B is false or certain, being one or the other. On the contrary, figure 7d) shows that the fact that A is true must necessarily be true.
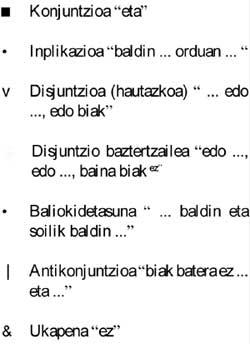
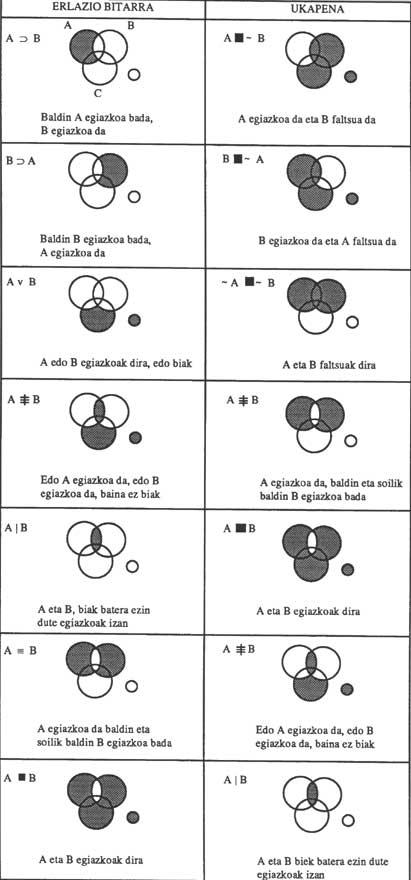
Figure 8 shows the diagrams of all binary relationships between terms A and B as well as their denials. If the third topic C is included, the diagram is easily extensible to all three topics. Before we will explain the wording:
For now we will leave here the description of the Logical Diagrams. In the next issue, Elhuyar. Issue 26 of Science and Technology (September) aims to publish the second and last part of the article, ending the complete description of the topic.
Buletina
Bidali zure helbide elektronikoa eta jaso asteroko buletina zure sarrera-ontzian