


The beauty of chaos
Classical science is said to end when chaos is created. While scientists were trying to see an order (a rule represented by mathematical equations of universal value) while studying the laws of Nature, the world was living behind the disordered appearance of reality.
The volutes of a wave, the ups and downs of the population, atmospheric disorders (both of the coastal cliffs and the various forms that appear in the fridge), the accumulation of stars in a galaxy and the network of blood vessels are examples of this irregular part of Nature. This discontinuous part appears as a controversial to human beings.
Dynamic systems
For centuries the phenomena of Nature have been analyzed from an analytical perspective. The analytical system considers in detail every part of a phenomenon. However, this perspective has errors to learn very difficult phenomena. Another solution is the systematic approach. According to this, it is best to have an overview of phenomena, even if details are lost.
The systematic approach is based on the notion of dynamic system. The dynamic system is a collection of objects that are interrelated and evolve over time according to a set of rules.
Dynamic systems are abundant in Nature. Ecological system (where prey and predators, hunger, pests, droughts, human attacks, etc.). exist), is an example of dynamic systems. Relationships between neighbors determine whether each species survives or is lost.
Scientists trying to learn dynamic systems produce simplified copies or models (corrected by mathematical equations) and try to make it work roughly as a real system. They introduce the model to the computer and see how it evolves over time and how it changes by changing the parameters.
For example, the ecological system can include different climates, number of inhabitants, birth rate, necessary daily food, animal behavior, etc. The model can end the loss of a species, when there is too much poor food or prey, or when there is balance between species. It all depends on the introduction of the parameters.
Sometimes system analysts analyze the final state of a system and try to rebuild it to investigate the causes that led the system to this situation. A famous example has been the following: in the Mayan civilization VIII. A model to explain the collapse of the 20th century.

The modern study of chaos began in the 1960s with an inconvenient discovery: a set of mathematical equations of simple appearance, capable of describing dynamic systems created by rigid and initial behavioral conditions. Small differences in the initial situation generate large differences in the evolution of the system. This has been called the butterfly effect. This word (half-joke) indicates that the movement of the wings of a butterfly, made here and now, influences the Beijing climate of the following month.
In the 1970s, a group of scientists worked to pave the way in the realm of disorder. They were mathematicians, physicists, biologists, sociologists, economists and physiologists. They sought explanations about the irregularity they saw in their work, using a new system of analysis.

Twenty years later, the term chaos has become a detailed description of a trend (scientific movement). Increased conferences, research programs and publications. Bouncing on a table came out articles about the strange dynamics of a ball, along with others about quantum mechanics.
The science of disorder has created techniques based on the use of computers. These techniques offer images of chaos, fascinating structures, hypnotic, delicate and of infinite difficulty.
In fact, mathematical models that try to show an ecological, climatological, economic or other systems of great difficulty, are formed by thousands of equations and require a lot of computer-processing time.

However, there are some models that are formulated with few relationships and have great difficulty.
A simple mathematical model can be based on an initial value to which we will call principle and, after some calculations, create a final value: Finishing. This last value is entered into the model as initial value and so on. The reintroduction of the output as input is called feedback. There is feedback, for example, when a microphone takes the amplifier output. In the end, the effect
is unsustainable.
Initial = 1.1
and calculate your square. The square of the value of the obtained Xbucal is calculated again, etc. The sequence of numbers obtained will be as follows: 1.21; 1.4641; 2.14358881;...

Keep taking the bills. But slowly numbers are getting bigger,
without limits.
Initial = 0.99
with the following sequence: 0,9801; 0,96059601; 0,922744694; .. Slowly, but this succession approaches zero. It is surprising that the numbers so close to each other (1.1 and 0.99) have such a different
behavior.
Finishing = (starting)2
The standard has been used. We can also use other formulas that occur to us and see the behavior. For example:
Finishing = R.Xinicio (1 - Start)
relationship, where R is any number that is chosen at the beginning. This formula is called logistic equation and was one of the first to be studied.
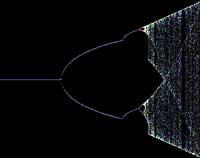
Instead of trying to interpret the succession of numbers you get, you can play graphically. In the horizontal axis we will place the values of R, for example between 2 and 5. On the vertical axis for the starting point
(Initial = 0.6, p. ex.)
We will situate the succession of the obtained values. Figure 1 shows the graphical representation of the result. Branches appear that separate to infinity.
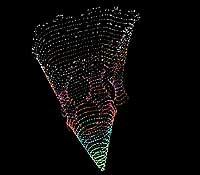
Attractor of Lorenz

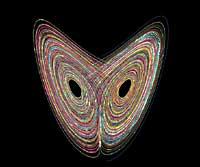
In 1963, Edwarz Lorenz was analyzing the swirls produced by heating and cooling the atmospheric layers. The phenomenon modeled by a system of equations, which seemed simple, graphically represented the path of the particle left within a whirlpool.
The image obtained, now classical, made known the difficult hidden structure in the equations and became the flag of the first examiners of chaos. Figure 2 shows the attraction of Lorenz.
As a meteorologist, Lorenz published his discovery in the journal “Journal of the Atmospheric Sciences”, far from the hands of physicists, biologists and engineers.
Fractals
Benoit Mandelbrot, a mathematician researcher who worked at IBM, invented a new element that he later called fractal.
Mandelbrot saw a well-known image in different places: at the height of commodity prices, surprised engineers in noise problems on telephone lines, etc. All of them saw the same characteristic, a signature that denounced chaos. When analyzed in more detail, the rules of evolution were increasingly difficult.
Artists find the ideal beauty in classic images such as lines, planes and spheres, a harmonious structure. However, reality shows a complex, broken and mixed geometry. Discontinuities, sudden noises and strange behaviors were described by Mandelbrot through abstract mathematical concepts. Fractal gives us a way to model this complex reality.
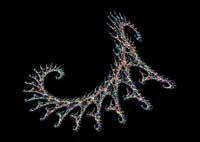
Fractal curves can be generated by a computer and have fascinating shapes, as shown in Figures 3-10. Corals, galaxies and fractal dragons represent creatures as complex as those around us.
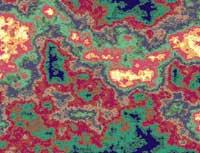
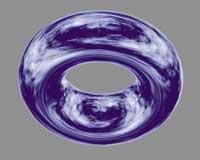
Figure 11 shows an image of the planet Acua-Tor. It is a toroid-shaped planet whose marine surface is covered by a fractal plasma. If the reader looks at it, he will soon see some species struggling to survive in Acua-Torre.
Buletina
Bidali zure helbide elektronikoa eta jaso asteroko buletina zure sarrera-ontzian