

Ecology of field work
What do we want?
Can an amateur naturalist participate in real research? Our idea of expanding the teaching of nature leads us to put understanding before mechanical teaching and not to place the ingredients in the domain as in memorization.
More and more young naturalists are demanding an adequate scientific infrastructure for the development of scientific works, considering the desire to work as a single criterion.
The general objectives proposed are:
1) Approach to scientific methodology. 2) Know the practical applications of forest ecology and the working methodology of professionals and biologists of the environment. Use many data and samples collected by fans to carry out scientific projects at the university. 3) Develop the ability to relate concepts from different areas (physics, chemistry, biology, informatics...). 4) Be aware that we are responsible for the management of our natural spaces.
What is the environment like? (Description of the physical medium)
Recent searches
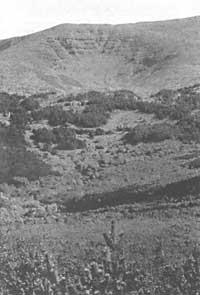
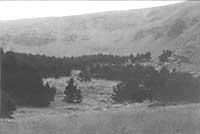
Mount Monkaio, located 30 km south of Tudela, is the place chosen for the first experience. Mount Monkaio rises south of the Ebro depression. Its summit, with 2,315 m, is a mountain of exceptional scientific interest. In this small microcosm of Monkaio we can tour most of the ecosystems of the Iberian Peninsula, taking a tour from the depression of the Ebro to the top.
This abundance of ecosystems is the answer to the different climatic conditions (semi-arid conditions in depression — less than 400 mm of rain per year — and progressively passes to moist conditions at the top). Therefore, it offers conditions for different plant communities (V. Drawing 1):
- Halophilous vegetation (saline) in the brackish endorheic depressions, surrounded by steppatic vegetation (as in the Bardenas) (xerophilous vegetation).
- Livestock (Quercus coccifera): vegetation adapted to aridity. Up to 700 m high.
- Holm oak ( Quercus rotundifolia): up to 800-900 m.
- Marojales ( Quercus pyrenaica): filtration vegetation between the Mediterranean and the Atlantic, up to 1200 m.
- Oak (Quercus petrea), 1000-1400 m.
- Hayedo ( Fagus sylvatica), up to 1200-1600 m. Birch (Betula celtiberica) appears in wet soil areas.
- Pine forests (Pinus sylvestris), up to 1700 m. A little above wild pine ( P. uncinata).
- The Blueberry ( Vaccinun myrtilus), the Cytisus purgans, and the only shrub or Noripurua ( Juniperus communis) that inhabit above the upper limit of the forest. Around the top (2200-2300 m) we find indigestion fields Festuca.

The original stone is formed by acidic colluvial sandstones of the triassic.
At 1300 m the area of 25x25 m 2 that is in the beech is delimited by a rope, where our investigations are carried out.
What is there?
Beech with 2000 more trees per hectare. First we will analyze the structure of the forest, measuring the following parameters:
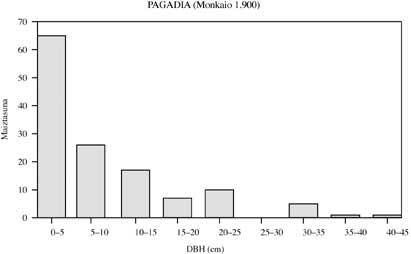
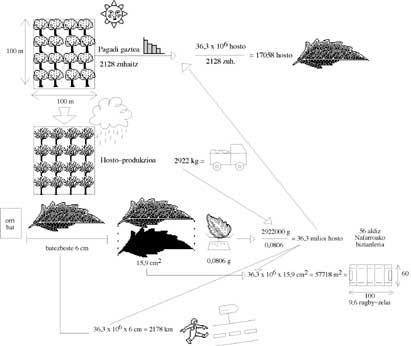
- Density: We will count all the trees located inside the area previously delimited (25x25=625 m 2) and number each tree (using insulating tape...). Once the number of trees in the sector is known, we will calculate the number of trees per hectare. In our example of Monkaio 2128 trees/Ha.
- ESO: Diameter of the tree trunk measured at the height of our chest (1.30 m). Measure the ESO of all trees in the sector and perform diameter classes with them (0-5 cm., 5-10 cm, ..). The base surface is then calculated. The base surface is corresponding to the standard (average) tree. It is a standard tree of 113 cm 2 of surface and 12 cm of ESO in the Monkaio beech.
Diameter groups (V. When analyzing the graph), we observed that young trees are the main ones. This is due to logging (especially for coal). Much of the forests of Monkaio. They were cut in the 19th century to make charcoal. If the forests had not been demolished, there would be large diameter trees and the density would be lower. You can think as a game the graph that each type of forest would offer. For example, if there had been clear, that is, if I had knocked down trees of a specific diameter, what would be the graph of the diametric groups? - Tree height: The height of a tree of diameter groups is measured and not of all trees in the area. Using an angle gauge, the ESO/Height ratio is established. In the early
years of its life, ESO grows little, then growth accelerates. Environmentalists follow the so-called “K” strategy. Pines, on the other hand, grow slightly in the early years, then stabilize (R strategy) and grow more slowly. If we cast the beech and change the pine, where the beech bushes remain, what would happen 20 years later? and after 70 years? Remember that the pine is heliophyll (solar) and fast growing. In the first years the pine forest would predominate, but gradually the beech plantations would grow and probably 70 years later the beech would dominate the pine.
Rhythm and forest production
In this section we will analyze the most important aspect of forest operation: Flow of organic matter.
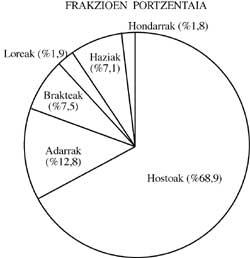
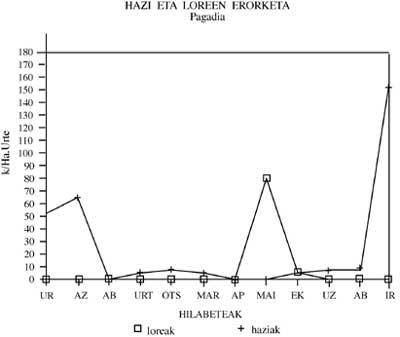
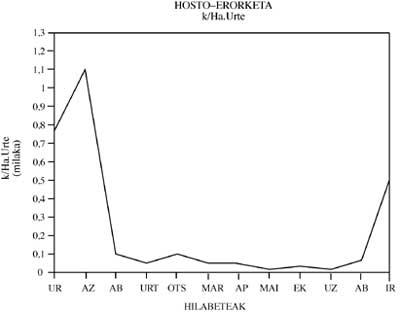
- Production: The main transfer of energy and materi in a forest is the fall of leaf litter. It is measured by pitting traps. The traps are easy to carry out by placing a plastic bag in an iron ring and placing them at a height of 1.2 m from the ground using 3 legs. A minimum of 4 are established for statistical use. Every month you have to go to pick up the litter collected in the traps, separating it and weighing it in different fractions (flowers, leaves, seeds, branches). To the sequence of the different times of fall of flowers, seeds, leaves, etc., the botanists call Phenology (Figure 2 and 3). Knowing the surface of the trap, you can extrapolate the number of each fraction (flower...) per hectare and year.
Forest production is limited by climatic conditions (light hours, average annual light, number of days with temperatures below 0ºC). For example, Picea produces 1.5 tons of litter per hectare per year in Norway and, at the other end, the rainforest produces 23.3 tons of litter per hectare in Thailand. - Decomposition rate: Organic matter closes its cycle with mineralization releasing nutrients to the soil. There they will reabsorb the roots.
What have we learned?
- Each year, a single has renewed 18,000 leaves, which is a great energy expenditure.
- So far we have presented field and laboratory data. Now the problem is that these data appear in a simple, comprehensive and reasoned way (V. Table).
- In most cases, scientific language is incomprehensible to the general public, and in order to arouse people's interest, we must show this scientific data in the most attractive way.
- How will we get it? Acting with visual elements and with scientific aspects, influencing people (especially young people) and increasing their participation.
- In this article we have tried to achieve objectives by practically using some real data. The hope of the authors is that the reader who accompanies us will be surprised like us with these topics and that the following experiences will be practiced in the forests of your environment:
- Calculation of the length of the leaf: a set of representative leaves is taken and its length is measured individually, with petioles, then obtaining the average length.
- Sheet weight calculation: as before, but weighing one by one, get the average weight.
- Calculation of the surface of the leaves: photocopying a sheet, cutting and weighing the photocopy of the sheet. Similarly, the known surface paper is weighed, thus calculating the surface of the sheet.
Buletina
Bidali zure helbide elektronikoa eta jaso asteroko buletina zure sarrera-ontzian