


Logical diagrams (II)
In the June issue some of the possibilities of the Venn diagram were explained. But this is not the only invented system. As we will see below, there are other systems to use in class and proposal logic.
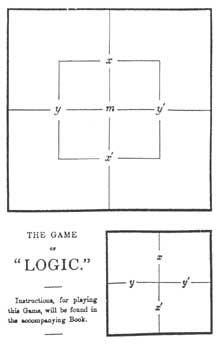
Another system is designed by the prestigious writer Lewis Carroll. Lewis did not use circles but squares. We will explain them as I used them. He divided a square into four equal squares to include all combinations of X and Y. Subsequently, for the use of the third matter included within this square another smaller one (Figure 1). Thus appeared all possible combinations between X, Y and M. Lewis used X’ (not X) to express the negation of the term X. Thus the upper half of the square is X, the lower half is X’ (not X). The left side is Y, the right is Y, while the inside of the small square is M the outside is M’.
He marked with tokens the appropriate regions to translate the premises of a syllogism. For this reason, in the regions with elements put the red tab and in those without elements the gray tab. In the two contiguous regions there were elements but in which I did not know, I put the red tab on the border line.
You could try to solve the typical Lewis problem:
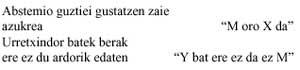
If the chips are placed according to the rules of Lewis, it can be concluded that “no Y is X” is correct, that is, to no nightingale annoying sugar. Classical logic would not accept this syllogism.
The Lewis diagram can be extended to n topics. Lewis himself shows us in his book Symbolic Logyc a diagram of 256 boxes adapted to eight themes.
Lewis' chart appears for the first time in The Game of Logyc. Along with the brochure, a card with the Lewis diagram and a bag with nine chips (four red and five gray) was delivered to buyers, as shown in Figure 1.
Lewis' diagram is of the type of diagrams invented by Alland Marquand John Hopkins University's cloister with the aim of extending it to n topics in the three-topic diagram.
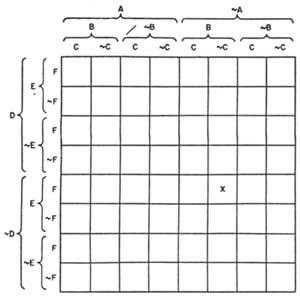
Marquand divided a square into equal boxes based on the number of items. Figure 10 shows the diagram for 6 themes. The x in it indicates the class &AB&C&DEF (neither A, B, nor C, nor D, E, F). This type of graph also allows solving problems of n themes, darkening the empty squares and marking with an X the elements.
Following this type of diagrams different divisions of the square have been proposed that are not mentioned here.
Another great mathematician and writer who has tried to represent the calculation of the proposal by diagrams is Martin Gardner himself, from the book entitled “Machines and logical diagrams”, whose essence we have drawn from this article.
Martín proposes a network diagram. Each issue is expressed by two vertical and parallel lines. Each will indicate a title. By agreement the left will be true and the right false. (Figure 3). If a topic is true, an X will be indicated on the left line. If it is false, on the right. The statements that relate two topics will be expressed directly horizontally, according to the table of the statement. We will call these directives bridges, since between two themes they play the role of bridge. Figure 4 shows some examples: Figure 4a) shows all the lines that can join two themes compared to the values of the corresponding table. The upper bridge indicates in diagram 4b) the relation A B, “A and B”, that is, of the four possibilities only the EC can be filled. However, the lower bridge indicates the ratio A&B, “A and not B”. In diagram 4d) we have the statement A, “Only if B”. Diagram 4e) shows the statement A B, “or A or B, but not both at once.”
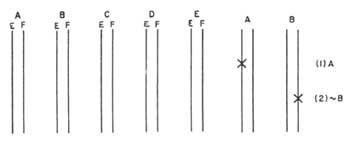
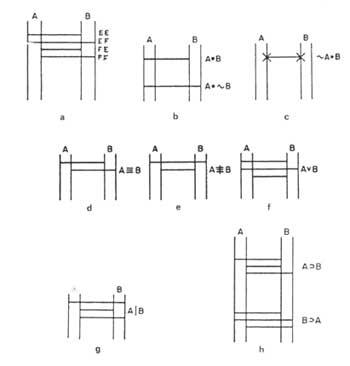
If in a statement we had a single bridge, for example &A B, “no A and B”, it would be true and we would write x at the two ends of the bridge. Determining the value of both issues 4c). A|B, “A and B are not really simultaneous”, in the diagram of the statement (g) three bridges appear; A B, “A and B”, which are missing from the statement. Therefore, we will say that these two statements are denied to each other. Statements A B “If A then B” and B A “if B then A” appear in the diagram in figure 4h). This type of statements have no other meaning than that indicated in the calculation of proposal by the bridges of the diagram. Therefore, a real proposition can only imply a real proposition. However, false propositions may involve both actual proposition and false proposition.
We have seen all the binary relationships between two themes using network diagrams. Two binary relationships will be equivalent if the same bridges appear in your network diagrams.
Let's look at the problem proposed by Martín, which is composed of the following premises:
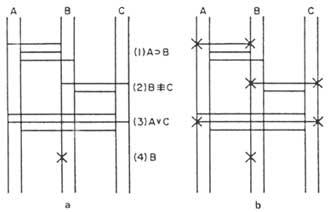
The first step is to represent the diagram of four premises (figure 5 a)). The second step is to explore the structure of the scaffold to determine whether the values of elements A and C are perfectly defined: As the value of B is known, we will begin in the real line of B. We have to look for a bridge that ends in this line. This bridge must fulfill that from the final line of the other end we cannot start another bridge that leads us to contradiction with the previous one. For example, two bridges of 1 premise end live. If we follow the second, it goes towards the false straight line of A. Therefore, we would have a contradiction. If we choose the superior, we would come to contradiction, after having traveled a longer path.
Therefore, the only bridge that does not contradict us is 2 premises, so we must pass through it writing an x at the two ends of the bridge. Therefore, 4 and 2 premises force us to say that c is false. The false straight of C tops a single bridge of 3 premises. Therefore, at that end of the bridge we will also write x. Crossing the bridge of 3 premises, we will reach the royal line of A, where we will put another x. We got fake C and real A. However, we must follow the study to ensure that we will not come to the contradiction. The true straight line of A, and the only bridge that does not contradict us, comes to premise 1. We write an x on the left end of this bridge. If we cross the bridge we will reach the true line of B without finding contradictions. In it we will place another x, closing the route. Then we will have figure 5b).
If we want to analyze other paths, you will see that there is no other possibility without contradictions. We conclude, therefore, that A is true, B is true and C false.
Here is the most difficult problem for you to try:
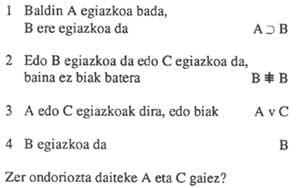
1 In August, I either wear my hat or leave my head empty.
2 I'm never beheaded in August if I tie myself.
3 In August I wear the hat or tie and sometimes both
To facilitate the exam we recommend the following topics:
A In August I wear the hat
B In August I wear a tie
C August blank
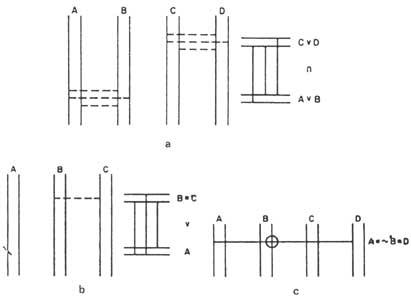
Diagrams of compound statements can also be obtained. Martin, as an example, shows us in his book (A v B) the diagram of the statement (C v D) (Figure 6a). The diagrams of the statements (A v B) and (C v D) represent the bridges by parts to indicate that they are provisional. If we later knew they were true, we would represent them with a full line. If they are false, they could be eliminated and we would represent with complete lines the missing bridges (those corresponding to the refusal).
The implication ratio is represented by drawing horizontal lines together with the diagrams of the statements (A v B) and (C v D), two pairs at the height of the statements. Now we assume that the lower line is true. Among these four horizontal lines we will represent the bridges of implication. Because there is no doubt of its validity.
If instead of A v B we had a simple theme, for example A, to express its provisionality, we would put in true straight \(half of x). If it turned out to be false then we would delete it and note it again in x. If it were true again, we would end x.
In diagram 6b) (B C) the statement v A appears.
We could represent a chain of topics related to the same relationships by directly marking the circle 0 corresponding to the topics that appear in the chain. For example, the diagram of the chain A&B D can be seen in figure 6c).
Buletina
Bidali zure helbide elektronikoa eta jaso asteroko buletina zure sarrera-ontzian