Weather patterns in the ACBC

The orography of Euskal Herria, due to its complexity, does not immediately do the work of meteorologists. In our geography there are numerous mountain ranges that divide the country into two climatic zones: the ocean extends from the coast to the mountain range parallel to the Cantabrian Sea, while the continental-Mediterranean extends to the south of this mountain range.
Given this, with the aim of improving the understanding of local meteorology, we have analyzed the daily weather situations. Given the similarity of many situations, it can be thought that its incidence in our territory will be very similar. And, grouping very similar days and performing the average of every day, weather patterns are obtained.
For the definition of the most representative meteorological patterns of the Autonomous Community of the Basque Country, we have designed a methodology of our own in the Department of Chemical Engineering and Environment of the Higher School of Engineers of Bilbao, developing a working methodology in real time adapting the data structure and storage system. Not a single method has been used, but the prosperity of using various channels has been sought.
Data from the hydrometeorological terrestrial surface network offered by Euskalmet (Basque Meteorology Agency), wind profiler height data and synoptic terrestrial surface maps made by the INM ("National Meteorology Institute") have been used. But it is not easy task to group days with certain weather characteristics in a territory, mainly due to the variability of the atmosphere. The Earth's movement and the combinations of energy exchanges between the atmosphere and the atmosphere and space generate infinite atmospheric situations.
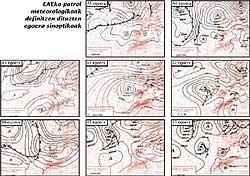
When defining the most significant weather patterns of the ACBC, after analyzing the data of a full year, we have classified 365 days in 9 groups or patterns. Four of them are affected by high pressure zones (A1 to A4) and five by low pressure zones (B1 to B5). Patterns A1 and A2, despite having inseparable synoptic maps, differ in weather data. Therefore, eight synoptic maps appear at the bottom and not nine.
When will Saharawi powders come?
Weather patterns may be available in applications such as data quality control, predictions, air quality analysis, etc.
In relation to air quality, it is well known that Europe is exposed to air masses of high concentration of atmospheric dust from the Sahara and the Sahel. Particles of natural origin from the Sahara desert have been observed in different parts of Europe and, although detected mainly around the Mediterranean Sea, occasionally appear in central and northern Europe. In addition, seasonal dependence has been observed. The detection of these episodes is much more difficult when air masses reach the European continent due to dispersion processes and the effects of local emissions.
The abundance of particulate matter present in the atmosphere can cause damage to both our health and the environment. Therefore, the European Commission working group on suspended atmospheric particles has proposed a procedure for controlling this particulate matter, both anthropogenic and natural emission.

It has been observed that in the Iberian Peninsula, for example, the number of days in which the particle limit PM 10 is exceeded is higher than that recommended by the European Union (particles PM 10 are particles of nominal size less than 10 microns in diameter). Therefore, it is necessary to know the situations in which the established limits are exceeded. Diagnosing weather patterns can help detect such events.
In fact, as expected, our study has shown that the remote transport of particulate matter affecting ACBC occurs mainly on days associated with certain patterns. Consequently, the identification of the pattern to which each event belongs allows knowing the probability of occurring.
The image on the left shows examples of Saharawi dust transport affecting the ACBC. These images show the optical depth of two types of particles: sulphates with orange and red tones, and dust with green and yellow tones.
As an example, it was chosen from 15 to 16 May 2000, which is classified in pattern B1. The images show that the Saharawi dust enters the ACBC from south to north after crossing the entire Iberian Peninsula.
Against acid rain
Weather patterns can also be used to conduct research on acid rain. One source of acid rain is sulfur oxides emitted into the atmosphere, which react with water vapor forming acids. In addition to acids, sulphate aerosols are formed in the process, small and harmful particles that can be introduced by air.
These sulfates, as with Saharawi dust, move from one place to another. In fact, in some agricultural areas high values have been measured, which is not normal, since sulfates are mainly due to industrial activity. In the case of ACBC, sulphates are sometimes entered from the European continent.
The top figures come from the NAAPS model created by NRL (Navy Aerosol Analysis And Prediction System). This global model, based on multivariate aerosol analysis, combines information from the satellite with information from the ground. In the example they appear on 27, 28 and 29 March 2000, classified in the pattern B3 (low pressure zone located in the Mediterranean).
The isolines represented in the upper figures express the surface concentration of sulphates in g/m 3, according to the colour codes arranged at the bottom of each figure. The sulphate mists, after crossing the north of France, reach the north of the Iberian Peninsula through the channel of La Mancha, crossing the entire CAPV.
What steps should be taken now?
Although weather patterns may have multiple uses, as databases increase, the expressiveness and accuracy of adapting patterns to the territory will improve. To do this, however, it is not enough to increase the amount of data, but to add to the procedure other filters and variables.
In addition, as the patterns are better defined and the parameters used to diagnose the patterns are adjusted, the diagnostic program will make a more comprehensive diagnosis of the days on which a given day is classified.
In the future it is expected to automate the most common uses and applications of this procedure. As a result, progress will be made in weather forecasting, in observing mass air transport, etc.
Weather patterns have been used worldwide since meteorology began as science. There are many ways to define weather patterns. Authors such as Ruosteenoja (1988) or Wilby (2001) used empirical orthogonal functions that Buizza and Palmer (1995) and Molteni and Palmer (1993) called their own vectors. Bretherton (1992) chose a method based on the analysis of canonical correlations. Hughes (1994 and 1999) defined weather patterns using regression trees. And Gilles (1989) with expert systems. Others prefer the analysis of clusters, the least square method or artificial neural networks of various types. |
Buletina
Bidali zure helbide elektronikoa eta jaso asteroko buletina zure sarrera-ontzian


