

Below the clouds of Venus (II)
In the previous issue we have seen the general image of the surface of Venus made by astronomers. The main tools and techniques that are being used for data collection are described below. We will also mention the most interesting and unique structures that have been found throughout the study and that have been left out of the general perspective.
Of course, the Magellan space is equipped with two radars. One altimetric and one synthetic aperture (Syntetic Antenna Radar). The first produces pulses and measures the time until it receives its echo, measuring the distance to the surface below. At the same time, the telemetry of space limits its orbit with respect to the mass center of the planet. If we subtract from the distance to this last point the height measured by the radar, we will calculate the radius of the planet in the vertical of the observation point.
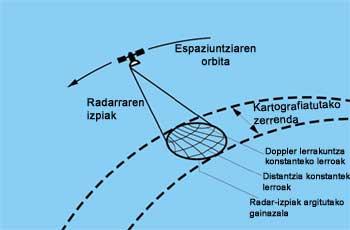
The synthetic aperture radar measures two magnitudes to identify surface variations of the planet. On the one hand, there is a doppler slide that affects the frequency of radar emission by speed with respect to the planet of space. The analysis of this data provides us with the position of the object under study along the direction of the satellite movement. On the other hand, if we measure the time it takes the echo to return to the radar, we can get a second coordinate. The radar considers it as a set of objects that we would like to analyze the surface. This data series allows us to build a two-dimensional image of the surface. The above is graphically represented in the figure. As you can see, space maps a list on each tour. By combining the data collected by both radars, three-dimensional images of the planet's surface can be obtained.

All these data would highlight possible changes in one place (if they were higher than the radar resolution) in the second mapping of the place. However, researchers at the Magellan project have developed a special technique to detect levels of a few centimeters, called three-step interferometry. With some luck it would also be observed in case of a lava flow and would be the direct proof of the geological activity of Venus.
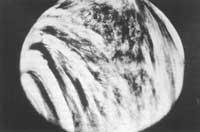
The last detail will be given to finalize the explanations on the radars analysis procedure. In the images obtained by radars, the differences in brightness depend on the slope and roughness of the surface. The plains appear darker than the abrupt areas. On the other hand, if the pavement is smooth to the wavelength of the radar, the figures appear darker on the scale up to half a meter than if it is rough. This difference is because the radar emission differs depending on the surface. It seems, then, that the dispersion of the rays emitted by the radar depends more on the geometric particularities of the surface than on the variability of the reflection.
This latter magnitude is due to the dielectric difference between the atmosphere and the surface and varies depending on the composition of the rocks. He delimits the percentage of the lightning that will come from the radar. To study the composition of the rocks, Magellane also receives its own radio broadcast. Problems have already been raised in some regions. For example, the emission around the Maxwell is not easy. Depending on the electrical characteristics of a local region, the small fractions of a conductor mineral must be dispersed. Iron sulphides are best suited to observations, but deeper studies indicate that their duration would be greatly reduced due to corrosion of the atmosphere of Venus. Iron oxides and magnetite may also be accepted, but it is difficult to explain their appearance.
One of the most important references when analyzing planetary surfaces are the local craters, since among other things the age of the surface can be calculated. In the case of Venus, however, they are less useful. On the one hand, because they are insufficient. Extrapolating the data from the first cartography, some 1,000 craters of a width exceeding a few kilometers (amount not comparable to that existing on Mars or the Moon) are calculated.
On the other hand, because erosion on Venus is much softer than on other planets. This last statement may be surprising given the atmosphere of Venus, but it is not so. The main agents of erosion are water and wind on Earth and micrometeorites on the Moon and Mercury. On Venus we have no water, the winds are weak and the micrometeorites are destroyed as soon as they enter the atmosphere. Therefore craters have a new appearance and cannot be dated based on the level of degeneration.
However, the wind deserves a special mention. Strong winds in the upper layers of the atmosphere are believed to cause surface winds. Its speed does not pass by a few kilometers per hour, but due to the density of the atmosphere, its influence is similar to that of the wind on Earth 20 or 25 km/h and is, as it is believed, responsible for certain transports of materials. The images obtained in a region near the Aglaonice crater are very similar to those of land dunes examined with radar. By analogy, in that region we would have a dune zone, of course the dune zone created by the wind. In another volcano appear luminous zones on the slopes of the same side of the volcanoes. It is believed that the wind whirlpools have dragged the material previously projected by the volcanoes, leaving the lower layer in sight.
The atmosphere, from another point of view, has a very important influence on the formation of craters resulting from the impacts of meteorites. Except on Venus, it has resulted in a series of unprecedented structures, such as dark circular spaces found in many regions. Darkness indicates that these areas are smooth at centimeter scale. This peculiarity is due to the destruction caused by a shock wave caused by a meteorite despite its dissolution in the atmosphere and its arrival on the ground. Meteorites therefore need a minimum size and duration to reach the crater. Therefore, the smallest craters found are about three kilometers in diameter. In addition, many craters appear around them surrounded by the dark regions mentioned above. The shock wave would also cause these singular spaces.
When the craters are larger (about 15 km in diameter) they have different levels and accumulations of waste or are associated in groups. According to scientists, these structures have been formed because the meteorite has broken a little before the impact.
In general, craters have no rays of matter like those of the Moon, as atmospheric density prevents it. Other times the shock stain is shaped like a butterfly. In these cases it is considered that the meteorite has come through a transversal route instead of falling perpendicularly to the surface. The wake of the meteorite would prevent matter from expanding in the direction of its route.
There are other more inexplicable structures. In latitudes below 30 °, around the equator are craters. Each of them is in the focus of a dark parable, all parallel and open to the west. The branches are between 500 and 1000 km long. They have tried to make different explanations. One, the most credible, proposes the wind as the creator of parables. Due to the fragility of the wind near the surface, it is estimated that due to the collision the waste reached a height of about 50 km. The local winds blow with force and west direction forming parabolas.
On Venus there are few large craters. No wonder its surface is relatively new and that large meteorites are currently scarce. Considering that we are talking with data of 90% of the surface, the largest crater is the Mead, with a diameter of 275 km. It has two rings, the original probably inside. The interior is altered by volcanism after the collision and has no peaks in the center as if the crater were an impact on other planets. The space between the two rings seems to be the later sunken.
There are more special structures (including some generated by lava), but the second mapping cycle has just ended and data from 90% of the surface has been collected. Therefore, soon we will have to talk about Venus again and then we can give more explanations.
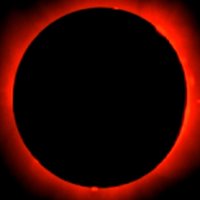
EPHEMERIS SUN: On June 21 the Sun enters Cancer at 3h 14min (UT). Summer begins.
PLANETS
|
Buletina
Bidali zure helbide elektronikoa eta jaso asteroko buletina zure sarrera-ontzian