

Development of a geographic information system for the management of the peri-urban green areas of Vitoria-Gasteiz
History of Geographic Information Systems
Given that the detailed and exhaustive description of the Geographic Information Systems (and taking into account that the object of this work is not this), only a few strokes of this type of applications will be given here. The differential feature of GIS is the ability to store, manage and, above all, analyze georeferenced spatial information. The fundamental idea on which this capacity is based is the dual character of geographic information, since it can be said that geographic information is composed of two parts: the cartographic part, that is, the maps formed by points, lines and surfaces, and the alphanumeric part, which is the one formed by the data associated with each cartographic element, which in some way will be the firewood of the cartography. At this point, who knows some computer science, I would say that GIS are simple hybrids between CAD and DBMS applications (database management systems), while these tools allow to integrate under the same perspective different types of information, such as cartographic maps, alphanumeric databases, photographs, satellite images, statistics, graphics, etc., and more importantly, all of them are able to develop new complex analyses.
This analysis can report numerous results. In Navarre, for example, the Department of Territorial Planning and Environment of its Government has used a GIS to define the characteristics of the hunting grounds existing in the Foral Community and to establish from this data the number of hunters that each of them can take. To cite another example, the Centre for Environmental Studies of Vitoria-Gasteiz, in collaboration with the City Planning Department, has defined the main lines of the deployment of the city from the East, Salburua, through the SIM (Environmental Information System).
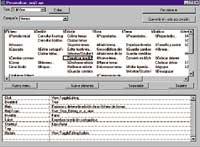
Today, however, GIS, like most new computer applications, offer a more interesting option: through programming languages, the user can adapt the software to their liking, adapting the computer tool to their specific needs. The project described in this article has followed this path. In this case, based on the Spanish version of the GIS ArcView, and using its language (Avenue) (Figure 1), it is proposed as a basis for the creation of a computer application that helps manage the areas of the green belt of Vitoria-Gasteiz.
Areas of the green belt of Vitoria-Gasteiz
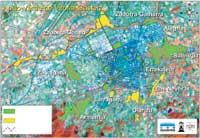
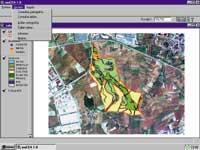
The green areas managed by the Center for Environmental Studies (CEA) and planned for this project are three: Armentia Forest, Zabalgana Park and Salburua Wetland (Figure 2). Although each unit has a specific character, all have characteristics that from the management point of view can be commonly considered.
The Armentia forest is an extensive mosaic of quejigales and grasslands that extends along the slopes of the Vitoria Mountains. The passage of livestock and people has caused the forest to be filled with hundreds of tracks and trails and that logging over the centuries has degraded the quejigal. Armentia has always been an important place for the leisure of Vitorians. For a better use of the area, from 1998 the CEA has started the work of conditioning the forest by constructing a reception area with tables, fountains and parking at the entrance of Armentia, the reorganization of existing trails along the forest, the pedestrianization of a few, the preparation of two others for those circulating on mountain bikes and the elimination of the rest, as well as the recovery of forest vegetation from some areas.
The process that gave rise to Zabalgana Park was totally different. The old quarries of Zuatzu were built on remains, the adequacy of this green area, which took place at the beginning of the decade, deeply modified the landscape structure of the area. As a result, the distribution of spaces in this green area (forests, pastures, lakes...) is due to rigorous human planning.
As for the Salburua Wetland, it is the result of the restoration work of the lake that dried up at the beginning of the century to generate farmland. In the mid-1990s, the so-called Betoño Lagoon was recovered. The ecological conditions thus created caused the return of numerous birds and animal species in general, this area being one of the most important wetlands of Alava. In the coming years, following a plan organized by the City Council 1, this green area will have a large extension and will be integrated in the development of the city in this region.
Being so different, the integration of these three green areas into the same system was a series of difficulties. Therefore, at the time of the drafting of the project, special importance was given to the organization that the application databases should have, a question that, being at the base of the project, would condition all subsequent work.
Database structure
Analyzing the trajectory of CEA in the management of green belt areas until 1998, the functions required for such an application were determined, from which the structure that GIS should have was defined.
The first step was to organize the cartographic information that would serve as the basis for the system in different layers. For this purpose, two criteria were used: on the one hand, elements of a homogeneous character were joined from the management point of view, and on the other, the limitations established by ArcView were taken into account, that is, the layers had to be formed by points, lines or surfaces and the elements of these three categories could never be represented together in the same layer.
In this way, five cartographic layers were defined: furniture (tables, informative panels, sources...), sectors (defined by land of homogeneous use of the soil: quejigal, pasture, lagoon...), management units (formed by units with the same treatment in terms of management), isolated trees (located inside a grassland or in a reception area, which require other conservation tasks with the forests, etc. ).
The “core” of each layer is a database containing spatial data. This table, called attribute table, in addition to spatial information, can store alphanumeric information directly related to the elements. On the other hand, it is possible to relate this database to other tables. This greatly increases the system's ability to store information. In our case, and following this philosophy, we form a tree-like network (Figure 3).
In the meetings held with the managers of the CEA it was observed that the main instrument used at the beginning of the work was the so-called “work unit”. The work units have a fundamentally economic character: each of them is a concrete work that is assigned to a company at a certain price, such as “the planting of herbaceous plants plus the complementary work, that is, the provision of seeds, the mechanical dispersion, the covering, the care to be done during the guarantee period and the first harvest”. Obviously, a work unit can be applied to different cartographic elements (for example, a grassland and a reception area), and each cartographic element can be the object of different work units. Therefore, the relationship between the work unit board and the space board had to be multiple between the m and n elements.
On the other hand, each work unit is composed of different activities (which in this case would be the different tasks performed by the company over time to carry out the complete work), and even other offers have been collected for each unit (regardless of the winning offer of the work in the auction). It was considered very interesting to collect all this information, so it was collected in two other tables. These boards are associated with work units, although in this case it is clear that the union between them is between 1 and n. Finally, another table shows the events that cartographic elements can suffer, such as fires, furniture damage, pests and others. Once the information was structured, the next step was to define what the application would do, that is, define its functionalities.
Main features of the application
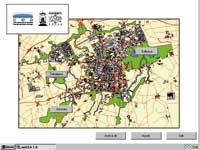
This application consists of three modules. The editing module, which serves to introduce and update the information in the system, the query module, which will be used to analyze, view and organize the information, and the outputs module, which will serve to publish the information contained in the tables as a report and to create maps and cartographic plans. It should be noted that the instruments that make up the program have been made as accessible as possible, since it has been taken into account that the technicians who will use the application will not be experts in GIS. Therefore, a menu has been created that will function as the main reference within the application, from which all the commands of the program are available (Figure 4).
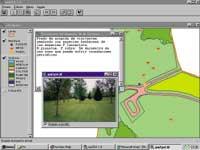
As can be seen, the dual character of geographic information has been taken into account, and each of these modules has been divided into two subsections: one for working with cartography and another for managing tables. As for the consultation module, the different tools of the system for the analysis of the cartography include the realization of zoom, visualization of panoramas, obtaining information on specific cartographic elements, etc. allow. In addition, each element can be added a text box that describes its characteristics or that can be used to store any other comment and, to cite one of the options that the module has, each element can be associated with one or more photographs (Figure 5).
On the other hand, and entering the consultation of tables, the most important tool available can be the so-called “query builder”, which allows any logical consultation on the information contained in tables, such as “the nature of the work that has been carried out in the reception and the economic cost that they have supposed”. In addition, when the data is numeric, the program offers the possibility to perform statistical calculations.
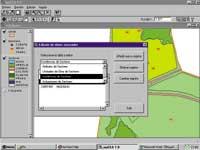
In case of adding, deleting or updating data, the editing module will be used. The tools developed for editing allow you to create, modify, divide, join or delete cartographic elements and update the information contained in the tables. These functions are very useful, for example when installing a table in the green area or when dividing a grassland into two and planting trees in one of the parts. However, the most important tool that this module has, because it is the most used, is the so-called “attribute editor” (figure 6). This functionality allows direct editing of the information contained in the tables from the mapping.
Finally, the module for publishing the data contained in the system has been developed. In this area, the Vitoria-Gasteiz green zone management application offers two integrated options in what has been called the outputs module: on the one hand, a submodule for creating maps that allows the preparation and printing of elaborate graphical outputs (including titles, leiendas, compass and graphic scales) (figure 7), and on the other, a submodule for generating reports that facilitates the organization of data from tables through a process. All this has been completed with printing functionalities that allow to implement the main processes that the application must perform, that is, the introduction and modification of data, the query of data and the output of data.
Conclusions

The interest of the Center for Environmental Studies of Vitoria-Gasteiz in the development of applications of type GIS, along with the rapid growth that the area of the GIS experiences, have been fundamental for the creation of this type of projects. And I say “project”, although after reading this article it might seem that everything is done, because this application still needs a lot of time and work to reach maturity. The application will be tested in beta form after new short-term retouching, and the newly constituted Olarizu Environmental Park will be integrated into the system, thus taking a step in the management of all the green areas currently in charge of the CEA under the same criteria.
In short, if this work has clear consequences, that is, if you want to know, use and conserve the environment in a more complete and effective way, you will need to take into account the impact of new technologies and take advantage of the opportunities they offer.
Buletina
Bidali zure helbide elektronikoa eta jaso asteroko buletina zure sarrera-ontzian