

Music is not only art, but also mathematically
Specifically, sound is what we hear when a sound wave reaches our ears through the air. In the words of psychology, sound is the response produced by the sound wave in us as a stimulus. We perceive the physical properties of the sound wave as sound characteristics. The most important features are tone, loudness and timbre.
Tone
On the scale, if we take ever more demanding notes, it seems to us that we go up in tone DO, RE, MI... This tone is characteristic of the note and the height we perceive in the case of periodic sounds is related to the frequency of the sound wave. For example, the frequency corresponding to the note called Middle DO is 261.63 Hz. (Hertz = One oscillation per second).
Sonority
The loudness, the sound, is the force it has when listening, related to the intensity of the sound. Although the intensity is measured in square meters, it is usually expressed in decibels. For example, the noise level of a car that circulates at 80 km/h is approximately 45-50 dB.
Doorbell
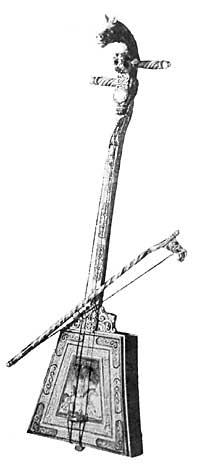
The xirula and the drum can play the same note with the same loudness, but the melodies will not be the same. The feature that makes the sound feel hard, soft, soft, sweet, warm, dark, etc. is the doorbell. These sound differences are due to the physical properties of the sound wave, but their determination and definition is difficult.
The goal we pursue is to find a way to mathematically analyze sounds, that is, to use sounds as mathematical objects.

However, we must first indicate what kind of analysis we want to perform, that is, with what characteristics of sound we are interested in working. For us the most important thing is tone or height. We can get more interesting songs by keeping the loudness constant (that is, the volume) and the timbre and changing the height, which by setting the height (with a single note) and changing the loudness and the timbre. In our work it seems logical to limit oneself to musical notes, that is, to the tone of the sound.
Without specifying much, let's look at this concept a little bit. In periodic sounds we have said that the tone is related to the frequency of the sound wave. The frequency f is the inverse of the period T, in which the period is the time interval of the frequency of the sound wave, measured in cycles per second and in Hertz.
Each note has a special frequency. When we move forward on the scale, DO, RE, MI... frequency is increasing, but as the rationalization of note advance rises arithmetically, frequency follows a geometric progression.
...DO130.81138.59RE146.83155.66MI164.81FA174.61182003SOL196.00207.65LA220.00233.08SI246.94DO261.63...The frequency doubles by octave. Since in each octave there are 12 semitones, the frequency of each semitone is obtained by multiplying the frequency of the previous semitone = 12 ton2 by the constant factor 1.0594631. The frequencies thus defined are not real but physical and close. But this approach is quite good, the scale that is formed with these frequencies, called the tenped scale.
After delving a little deeper into the tone concept, let's see how we can analyze it. Trying to express oneself graphically seems logical. On staves, for example, we draw notes of different tone and duration. Each note determines two values and vice versa; it is defined by two values. Values are tone and duration. We can try to draw these two values in a coordinate axis. In the axis of abscisas we will indicate the time and in the ordered the height. Thus, each of the notes of the staff is represented by a line of coordinate axes.
The notes, as for their duration, can be round, white, black, eighth notes, sixteenth notes, etc., where each duration is half the previous one. In abscisas, for example, we can take as unit the middle eighth. If more precision is needed, only another smaller unit of time can be taken. Logically, negative time is not allowed, so the abscises are advancing on the positive axis.
In the ordered, the unit will be semitone. Just start on the 7'5 octave IT and finish it on the DO, as the musical extension of the piano is smaller and the extensions of other known instruments. As point O we can take the central note DO, for example, and from here we will draw all other notes. The stretched scale thus defined, height of each note
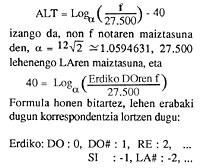
Using this correspondence or expression, each song (or rather, each melody, considering that any song is composed of different melodies) corresponds to a graph, and vice versa, each graph represents a melody.

This correspondence is bijective, that is, a graph represents a single melody, at the same time, conversely, the melody determines the corresponding graph. If the sensation that gives us the melody is that the notes are going up (that is, they are increasingly more demanding), the graphic also goes up and if the notes go down, the graphic goes down, that is, the verses corresponding to those notes go down.
If it seems to us a continuous melody, this continuity will be transmitted to the graph. Also, if the melody is discontinuous (for example, silences), the chart will be discontinuous. In other words, the information provided by the graph is the same information as the melody. The difference is that the information we see is more understandable or easy to work with.
In essence, to facilitate things, we consider that 2 notes cannot be considered simultaneously, that is, if two notes are in the same vertical, that is, in the same time interval, we will assume that those notes are notes of two different graphs. Thus, the graph will be an injetive, but on the other hand it does not have to be suprajectivo, since the melodic silences in the graph become empty spaces.
This learning we are analyzing is only a graphic representation similar to the staff. Any song drawn on staves corresponds to a graph. Notes used on staves to indicate that you have to play a stronger or weaker song, lighter or slower, etc., or all symbols (links, dots, etc.) can have a special symbol on the chart.
Thus, in essence, any song can be read. But, although theoretically it can be done, in practice it is very difficult. Taking any song, seen the corresponding graph, it is difficult to note it.
The advantage of this expression is that any melody can be analyzed mathematically using the corresponding graph. For example, we can define certain properties such as: we say that the melody is high when the arithmetic mean of the height of all the notes exceeds a fixed value or, for example, if the average duration of all the notes is less than a constant, we say that the melody is fast, etc. In other words, we can mathematically analyze the songs (using their corresponding graphics). In any case, out of curiosity, we can hear the opposite of any song (that of your chart), the verse, both at once, etc.

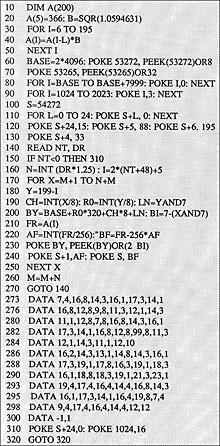
Based on this idea, as an example, we have these 2 simple computer programs. In the first, with the function in line 10, while drawing the graph, you hear the melody and the second, somehow, does the opposite. The melody, given in 2 numbers for each note through the DATA, appears simultaneously the corresponding graph. These two programs are very simple. The second, for example, does not admit silence.
Everything done so far, technical models and programs, in practice, have no great value. To be able to see your chart through any song, we need a first score, then convert the notes into two numbers (height and duration) and finally type them into the computer. In addition to difficult and laborious work, the error is very simple. It would be much more convenient to insert the song directly into the computer.
For example, it would be very beneficial to do something like this: record the song on a tape, put this tape on a cassette that would somehow be attached to the computer, and once the different melodies of the song are separated, give the necessary commands to the computer so that these melodies and their graphics appear simultaneously on the screen. But this already enters the field of computing.
If we had the opportunity to do so, we would go one step further: not only to analyze songs, but to create new songs, that is, for the computer to invent new songs. Basically, we will draw a random graph, that is, with the height and duration of the random rectangles. But when we hear his melody we see that it makes no sense, we find no meaning. It is heard as a succession of unrelated notes.
What should be done to make melodies (i.e. graphics) meaningful or meaningful? The question to answer is: What does the chart of the melody "Ikusi mendizaleak" have, which does not have a random chart, so that the song has meaning? If we answered this question, the computer would make a program to draw only reasonable graphics and through these graphics (i.e., through melody) we could create new songs. In any case, much remains to be done.
Buletina
Bidali zure helbide elektronikoa eta jaso asteroko buletina zure sarrera-ontzian