

Genetic diagnostic tools for European honey bees
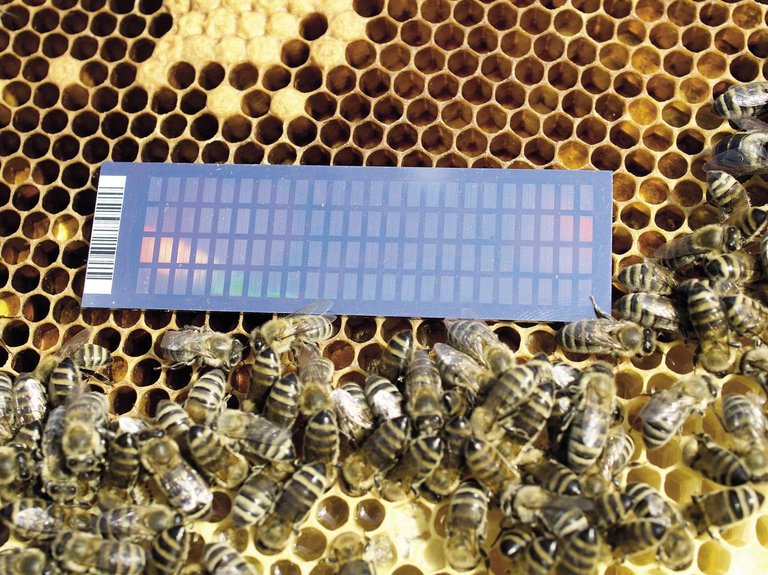
Apis mellifera or honey bee is currently the most important pollinator in the world, both ecologically and economically, and is frequently used for honey production and forest crop pollination. However, these bees are threatened by various factors. Among them, the reduction of genetic diversity and the loss of locally adapted subspecies have a significant influence, both for the growth and commercial import of queens on a large scale and for long-distance migratory beekeeping. To ensure the health of the world's population, it is necessary to ensure the conservation of local subspecies and to maintain their natural heritage and adaptability. Europe is rich in the genetic heritage of honey bees (represented by at least 13 subspecies of 4 evolutionary lineages of 5 lineages defined in the species) and has been a key region for the conservation and development of tools to facilitate it. A DNA microchip has therefore been developed within the framework of the European SmartBees project, which will allow the identification of European honey bee subspecies. Diagnosis.- This tool will facilitate and promote activities aimed at preserving sustainable conservation, controlled trade in queens, the verification of beekeeping products and the genetic heritage of local bees.
Protecting honey diversity
Honey bees (Apis melllifera) are found in various ecosystems, distributed in various evolutionary legends and at least 30 subspecies. A large part of this diversity exists in Europe, with numerous endemic subspecies divided into four lineages: Africa (A), Central and Eastern Europe (C), Western and Northern Europe (M) and the Middle East and Central Asia (O). However, human activity has gradually diminished the genetic diversity of European honey bees and their natural territory. Precisely because of the trade and import of queens and long-distance transhumance, one of the fears that exist is that the populations of native honey bees adapted to the environment will be reduced or lost, represented by non-native bees or by simple hybridization. It has been shown that environmentally-adapted honey bees have a higher survival capacity. It is therefore important to promote bee growth so that the bee can last in the long term.
Many projects have been launched in Europe for the conservation and growth of native honey bees, including genetic improvement programmes. Success depends on the control of the fertilization field and the monitoring of the genetic origin of the population. In this sense, a rapid, accurate and accessible genetic analysis tool is necessary.
The SmartBees project began with the aim of developing new molecular tools to describe and preserve the diversity of European honey bees. Thus, through a thorough sampling of the bee, a tool composed of single nucleotide genomic markers has been designed to describe its genetic diversity (SNP) and identify the subspecies of any European bee.
Procedure
We have sampled 22 populations (Figure 1) representing the four European evolutionary lineages and the 14 subspecies that can be found in Europe and nearby regions. For sampling of the populations, 100 workers have been taken from unrelated hives. In total, more than 2,000 samples, the most complete sampling to date with European honey bee.
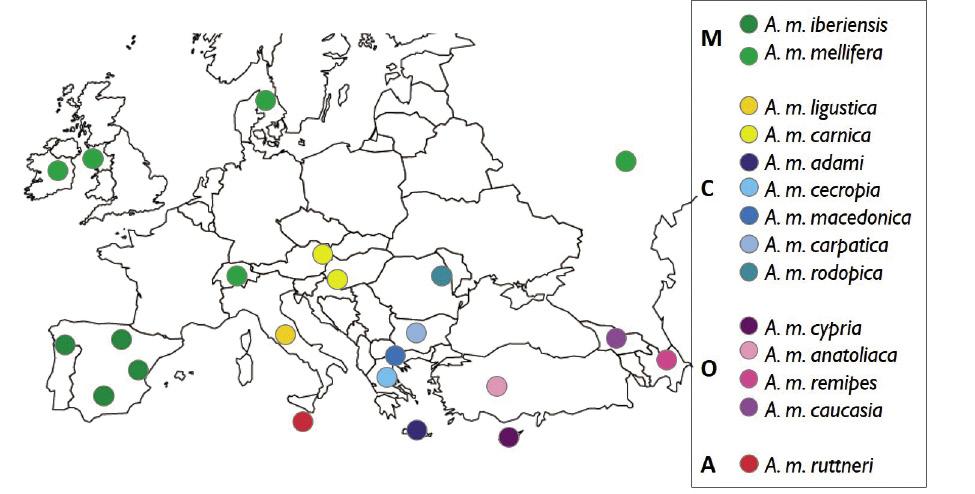
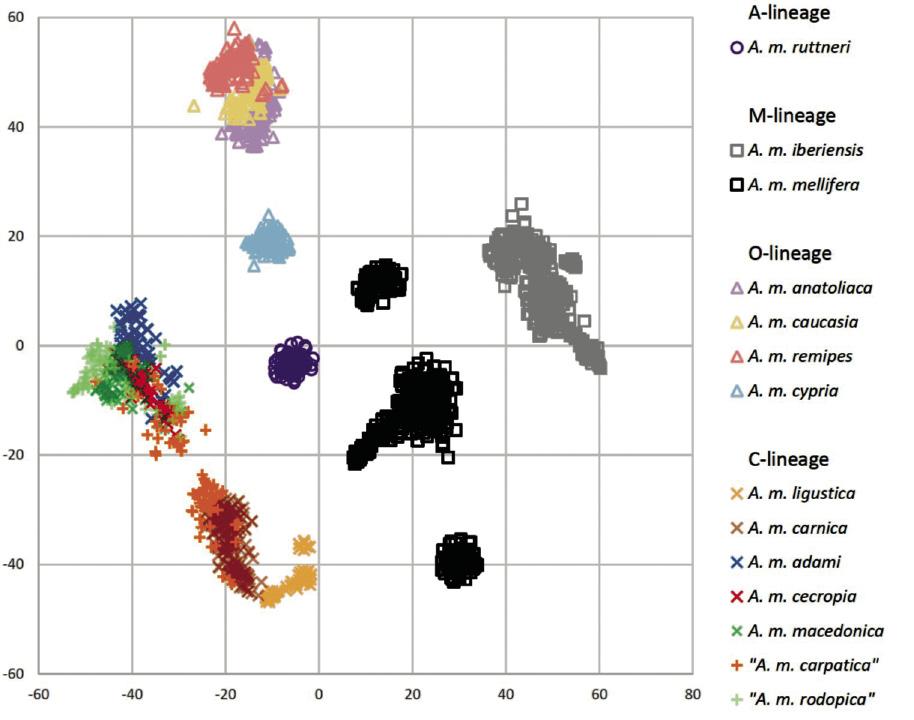
Once the samples are grouped according to the population of origin, their DNA has been extracted and sequenced. Genetic markers with the most information about the origin have been selected from the sequencing data. That is, the genetic markers that best characterize the 14 honey bee subspecies in Europe, exceeding in total the 4,000 mononucleotide polymorphisms (SNP). Genotyping results were represented using the t-SNE diagram. This diagram groups the samples as compact as possible on a two-dimensional map, replacing each individual with a symbol (Figure 2). With this method, the sampled bees have been grouped into isolated groups (points clouds) depending on their evolutionary lineage or subspecies. The only subspecies shows the African lineage, A. m. ruttneri, has been located in the center of the graph, among the other groups. In the O lineage, bees A. m. cypria have appeared completely separated from three bees less different from each other (A. m. anatoliaca, A. m. caucasia and A. m. remipes). The two subspecies of the M lineage have been well differentiated, grouping the populations of A. m. mellifera into three subgroups. These subsets represent remote sampling regions (Burzyan region, Russia, A. m. mellife supreme cluster in Figure 1) or isolated regions (Læsla Island, Denmark, lower cluster of A. m. mellife). Samples of line C have been divided into three subgroups: (i) A. m. ligustica bee, (ii) A. m. carnica together with several bees A. m. carpatica and (iii) a heterogeneous subgroup of bees A. m. macedonica, A. m. cecropia, A. m. A. m. rodopica and other A. m. carpatica.
Additional testing and machine learning model
In addition, 1,900 bees from hives have been genotyped for SmartBees breeding throughout Europe. With these 1,900 samples, together with 2,000 already genotyped (more than 3,900 samples in total), they have developed a statistical model that classifies European honey bees using machine learning algorithms. This model allows us to calculate the probability that a sample is one of the 14 European subspecies. Automatic learning models have a good side, not based on previous hypotheses, so they can detect subtle differences. This characteristic has been especially important for our study, since it has allowed us to differentiate these large quantities of subspecies with a close genetic relationship. In the original article (Momeni et al. 2021), more details can be found on specific methods of censorship.
Precision in subspecies allocation
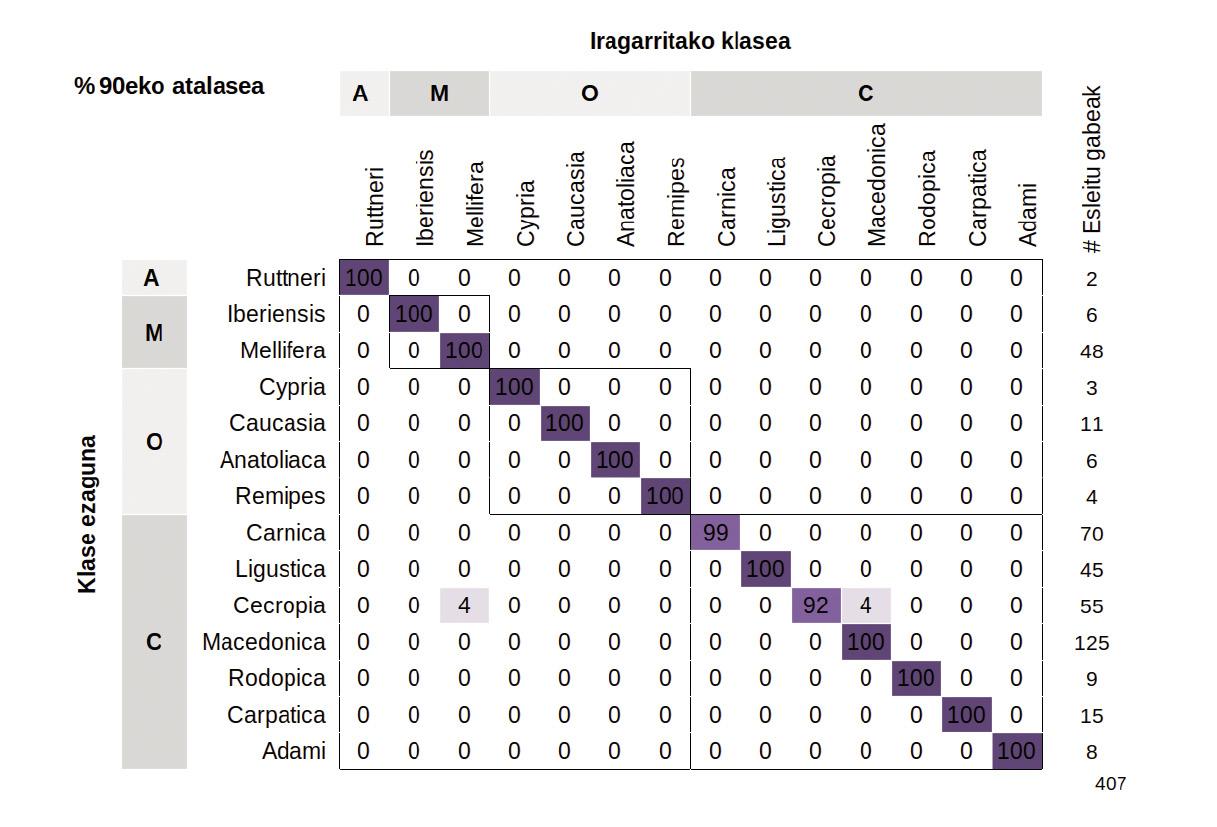
The model correctly assigned most samples with an average accuracy of 96.2%. The best way to visualize these results is through a confounding matrix, which represents the percentages of samples previously classified correctly or incorrectly (Figure 3). Central diagonal figures indicate the percentage of samples correctly classified, while upper and lower triangles represent poorly classified samples. The classification will be wrong when the samples announced by the model and those labelled are different subspecies. These errors have occurred, on the one hand, when the labelling of the samples tested has been wrong and, on the other hand, when the differences between the reference populations have been minimal, either because of their geographical proximity or because of human interference.
For this model to be applied in conservation programs and programs, we have set a minimum threshold of 90%. Thus, if the prognosis of a sample is less than 90%, it will be classified as “unallocated”. If the limit is exceeded, the subspecies concerned shall be assigned.
Diversity challenges and next steps
The diversity of European honey bees has been a major challenge in designing a diagnostic tool for subspecies. The divergence of the evolutionary lineages has made it possible for the genetic differentiation to be simple, using a few SNP. However, the distinction between subspecies has been more difficult because the divergence between species of the same sovereign has been recent and therefore genetically similar. In addition, fluctuations in the change of subspecies A. mellifera are not defined in some European regions and the artificial entry of foreign bees has blurred natural boundaries between subspecies. It may also occur that national programmes have interfered in the natural flow of genes and altered the genetic heritage of the original subspecies. Consequently, some subspecies have been easily classified by our instrument, while other samples have not been allocated. However, it is an adaptive dynamic tool that improves the baseline database and/or introduces new subspecies. In this respect, taking into account the ongoing investigations, the method is applicable to Sicilian A. m. of Sicily.
Availability
This instrument will determine the genetic origin of more samples, which will be essential in many respects: beekeepers will be able to determine their subspecies and degree of hybridization of bees and to endorse their products; those responsible for European conservation will be able to control the hybridization rates of beehives in tanks; veterinarians will be able to control trade in queens; and bee breeders will ensure their subspecies of queens.
Full scientific publication
Acknowledgements
This research was carried out with samples of beekeepers, breeders and collaborators. We appreciate your cooperation. The SmartBees project has been funded by the European Commission under the FP 7 KBBE programme (02.01.2013, Grant nr. 613960). Melanie Parejo has received a grant from the Basque Government (IT1233-19).
Buletina
Bidali zure helbide elektronikoa eta jaso asteroko buletina zure sarrera-ontzian