

and cartography reaches Antarctica
strong>Antarctica, that unknown, an ice-covered continent. But it is no longer so unknown. At least now, thanks to the work done by the Canadian artificial satellite RADARSAT, scientists and researchers from around the world have at their disposal a complete map of radars from all over Antarctica.
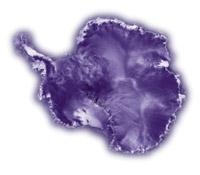
What is dark and what is light? Just as ground radars explore the sky in search of planes, reading the surface of the Earth, RADARSAT draws our planet. The common radar only warns when it finds something, but RADARSAT collects all the data from the line it is observing. This data can be used to subsequently map a region. Unlike photos taken from space, the dark area does not necessarily indicate that there is less light on that surface. As the radar reads, the dark zone does not indicate shade, since light and shadow are only the measure of reflectance with radar. For example, very fine dust snow and flat or non-toothed ice do not dissipate the beam that sends the radar against it. Therefore, these spaces appear dark on the map. However, rough materials, both broken ice and rock falls or crevasses, disperse the radar beam, thus appearing as obvious radar signals. When all the data provided by the satellite are placed together, a map of apparent shadows and clear points is formed, but it must be known that the light indicates that the radar beam is reflected intensely, while the dark area is not reflective.
In 1997, in the spring of the southern hemisphere, the RADARSAT satellite, equipped with radar, was collecting pieces from a puzzle for 18 days, night and day, in order to make another tool to help scientists explore the farthest and most difficult corner of our planet, Antarctica. Since then, scientists have worked closely together the pieces of these puzzles and finally presented the result in October 1999: the first high-definition radar map of the frozen continent, of great precision.
Mapping satellites
It is not the first Antarctic satellite map. The last map made before the work of RADARSAT dates from 1994. But the difference is clear: the development of the map was 13 years, from 1980 to 1994, and images of 5 different satellites were needed to make the map. However, some parts of the continent were dark, as clouds covered it.
Spinning around the Earth circulate many artificial satellites, many of which portray the Earth, but RADARSAT is the most suitable tool for taking high-definition images of Antarctica. That is why he was chosen by scientists to make the map. Why? There are three main reasons:
- First, because the satellite has a light source, the radar. Other satellites work similarly to the camera, using sunlight, that is, using the light reflected by things to photograph them. What does this mean? They cannot work at night. For its part, RADARSAT, which does not need sunlight, day or night, works exactly the same.
- Secondly, the radar crosses the clouds and can therefore work with the sky covered or clear. It must be said that many places in Antarctica, every day, are covered in clouds.
- Finally, RADARSAT has a feature that does not have other satellites: in orbit it can rotate around its axis, that is, it can be oriented.
Thanks to these characteristics, scientists have been able to take as many radar photos as they have been necessary in such a short space of time (18 days). But concrete measures have also been used on Earth itself, in Antarctica. These measurements have been made by researchers from the states studying Antarctica. In this sense, the new map is the result of international cooperation, which has allowed it to obtain great precision. The satellite, owned by the Canadian Space Agency, was launched by NASA from the United States and several research centers and universities have worked on data processing and processing.

Ice
currents in East Antarctica are one of the Antarctic currents. Before the RADARSAT mission, scientists knew very little about ice currents. Now for the first time they have been fully mapped. Ice currents look like large glaciers. As if they were conveyor belts, they cross the continent in zigzag carrying broken ice and snow. Some are very large: they can reach hundreds of kilometers in length and a width exceeding 50 kilometers. In addition, the small ice beds that feed them abound, as do the tributaries, forming a complex network. Ice currents move about
500 meters a year, while the ice around them barely reaches 25 meters a year. They therefore move much faster than conventional glaciers. Scientists do not know why they move so fast, as there is no such steep slope that it can produce this type of speed in the territory. According to one theory, the bottom of ice currents is a kind of lubricating bed on which ice slides easily. But you still have to complete that theory and check it out.
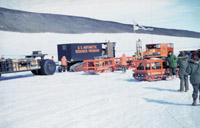
The precision is enormous. One proof is that remnants that leave snow tractors used to access research stations have also been detected. In fact, the frozen surface of Antarctica
low definition
From the point of view of the satellites that have produced maps, the ice continent was white and without great physical features. The new map, however, is a new and extensive window of observation of the continent, which will answer many unpublished points to scientists, but which, at the same time, will open the way to many other questions, since the white continent now appears with some rare and surprising features that had never been seen before.
Wonderful frosts
Undoubtedly, the most surprising feature of the map is the ice currents. They are rivers of ice that, like giant worms, slide zigzag towards the ocean on the ice sheet. They move 100 times faster than the ice sheet they cross. They carry most of the snow that falls on the continent to the ocean. Scientists, using data from RADARSAT and other satellites, consider that a fast ice system can reach 30 cubic kilometers a year to the sea of ice, which means that Bizkaia can cover every year a layer of ice 15 meters high. Ice currents are the most dynamic areas of the Antarctic ice sheet and scientists consider them highly sensitive to environmental changes.
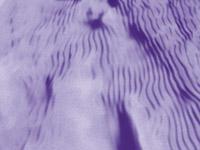
Another feature of Antarctica is the snow dunes. They may have a length equal to or greater than 10 km, but unlike the sand dunes of deserts, snow dunes are not usually very high. Researchers have many doubts about the mechanism of formation of these dunes. According to one hypothesis, the weak atmospheric waves generated in the leeward area of the hills and hills are the dune builders, but it has not yet been proven.
The spectacular ice currents are not the only spectacle of Antarctica. The map of RADARSAT shows that the continent is alive. The coast is surrounded by ice cubes that fall into the sea and break, the ice sheet melts and leaves to the sea, volcanoes show their heads on the ice sheet...
The map therefore offers a new vision of the southern continent. It is a new tool for researchers who, thanks to it and many other data, will not only serve to better understand the world of Antarctica, but to show how humans can change that world or how we may be changing it, both locally and globally.
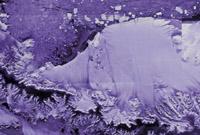
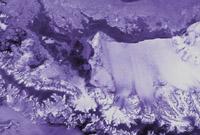
announced in 1978 that global warming on our planet could cause the destruction of the Antarctic Peninsula's ice platforms. Information provided by satellites indicates that this prediction can become effective. These two photographs clearly show how the apparent coast of the continent has changed. The image on the left dates from 1992, taken from the ERS-1 satellite. The right wing, 1997, is the work of RADARSAT and shows that the coast has changed considerably. In 1995, much of the Larsen ice shelf, with an area of 2,000 square kilometers (above Gipuzkoa), fractured in a thousand pieces, separated from the platform and fell into the sea. The causes of the breaking of the ice shelf are still unclear, as scientists have not reached an agreement. According to one theory, local climate change was responsible for: Some summers in Antarctica were consecutive more temperate than normal, which caused thaw of the surface of the platform and consequent rupture. However, another theory argues that the rupture is due to global climate change, global warming of the planet.
Buletina
Bidali zure helbide elektronikoa eta jaso asteroko buletina zure sarrera-ontzian