

Energy capacity of roofs of Alto Deba
2024/03/01 Elhuyar Zientzia Iturria: Elhuyar aldizkaria
How can one know the potential of a region to generate renewable energy? With the aim of the energy transition, members of the Debagoiena 2030 cooperation network went to Tecnalia in search of answers. This technology center of the BRTA alliance gave them the answer and was a significant result.
 None
None
Geographic information systems, GIS, were used to calculate the energy capacity of roofs in the Alto Deba area. “We could not do this project without GIS,” explains Eduardo Miera Zabraise, researcher at Tecnalia-BRTA. “When we talk mainly about the capacity of renewables, it is very difficult for us to go up and study from buildings to roofed buildings, the capacity of each roof. In the end, the amount of information we use is very large and must be crossed, and the only way to cross it for us is to use georeferenced information.”
This tool makes it possible to measure the energy potential of a region, for example calculating the potential for solar power generation if PV installations are carried out on roofs.
The first step is to complete the digital model of the terrain. To do this, from GEO Euskadi, a file with the orography and buildings of the area is included. And then they go to the cadaster to collect in another layer the characteristics of the buildings, for example the square meters of each roof.
Knowing the surface of roofs is essential to calculate the photovoltaic energy potential as well as the radiation received by these square meters.
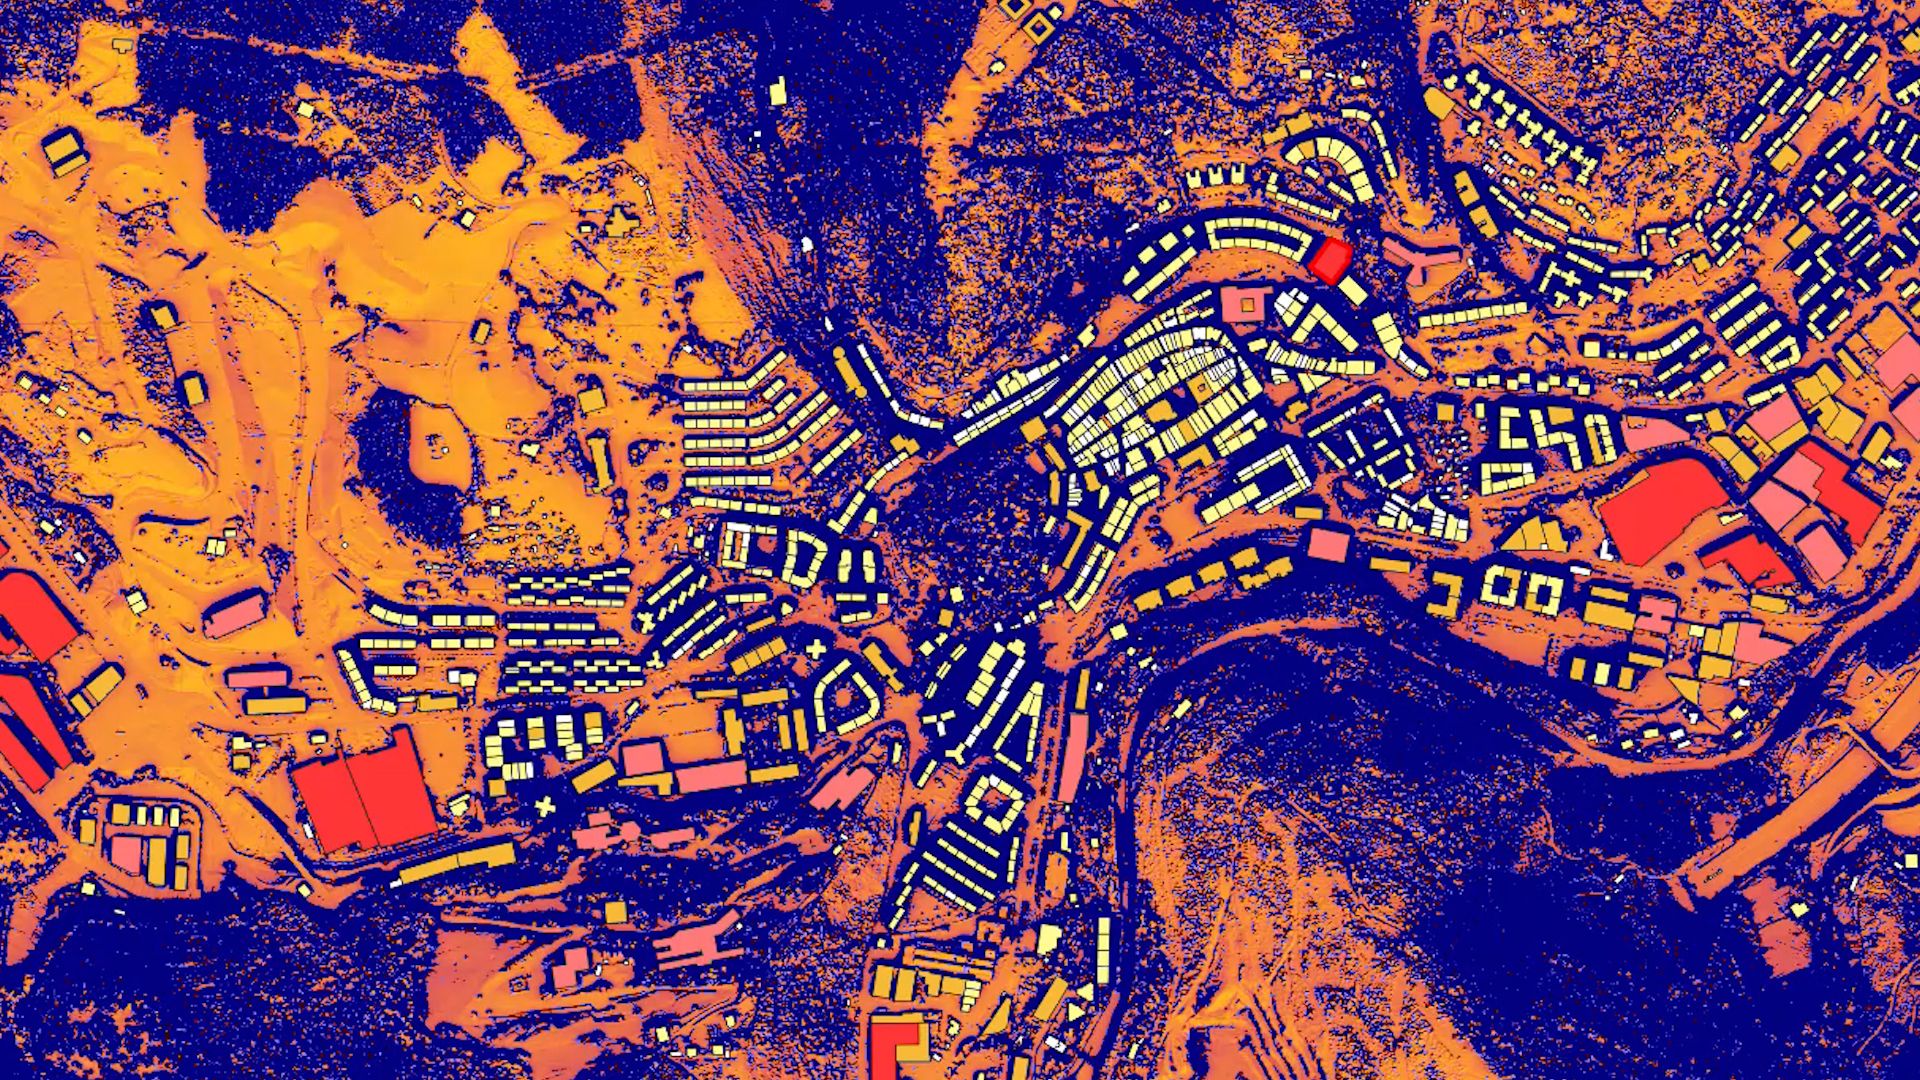
You have to calculate how much solar energy comes in. “We do some calculations using our models,” explains researcher Pablo De Agustín Camacho. “We take into account the typical climate year model at Alto Deba, as well as the radiation that is usually every hour for a whole year. We calculate the solar radiation per square meter in a year and get a map.” This map shows the locations with the highest solar radiation in light color and the locations with the lowest solar radiation in dark color.
They then apply a filter to this map to rule out areas receiving below a radiation level. And they finally cross the layer that contains the record data.
In this way they can calculate the solar energy that could be obtained in the region of Alto Deba by placing solar panels on the roofs.
The result is very visual. The most powerful roofs appear in dark red.
For example, in Mondragón, De Agustín highlights the case of the Uarkape pediment: “It has a deck of 1,700 square meters and we concluded that they are 1,100 useful. Therefore, a PV power of 230 kilowatts could be installed, which would be 223 megawatts per year. That is, approximately 200 households.”
Although the system allows to know the results of the buildings, the objective is to measure overall the energy capacity of the Alto Deba, and the final results have been calculated globally.
There are some 13,500 buildings in Alto Deba, but for the data to be as realistic as possible, the entire surface area has been subtracted square meters that are not useful, and so it has been concluded that 56% of the roofs are for photovoltaic plates. “With this we have seen that it would be possible to meet all the electricity demand of urban housing.”
Thanks to this work, therefore, it has been demonstrated that the energy capacity of Alto Deba is significant and that geographic information systems are valuable tools.

Gai honi buruzko eduki gehiago
Elhuyarrek garatutako teknologia