

When meteorologists speak
Map of Televisión
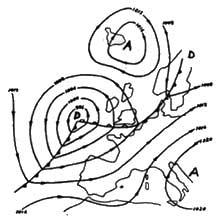
There is the image of a time map, like those that come out every day on the TV. It is one of those that is systematically reviewed several times a day in the meteorological offices. It is difficult to find two almost equal maps. Completely equal, again impossible. But in almost all of them we will see the same elements: isobaras, depressions, anticyclones, rain fronts or chubasco...
The weather map is a picture of the atmosphere that shows a photo made with a special light or things that cannot be seen at first sight. If the succession of such maps were like a film, it would be unfinished serial and we could see that the atmosphere is something alive; we would realize how they are born, develop, sometimes multiply, move and die depressions, anticyclones and fronts.
Thanks to the press, radio and television, the scientific words and phrases characteristic of the meteorological lexicon that until a few years ago only the specialists knew are known today among the public. People know quite well what depression is. For some, the anticyclone of the Azores is the godfather of the meteorology of the Spanish state, or of the Pacific of America, and many other things of the science of time are increasingly known. Here we will try to typify and clarify this puzzle of ideas and words, this maremagnum. We will form ideas and words so that the lises and you are more useful.
Thousands of observatories
The map presented is the surface map. This means: It is the representation of the atmospheric conditions of the land surface, at ground level, more specifically at the middle sea level. Like all the photos, this map corresponds to a moment. That is, in it appear the meteorological conditions at surface level at a given moment: the corresponding to the time of the map.
As you will understand, the thousands of observations necessary to make a map of this type must be carried out jointly and with total punctuality in their respective observatories: this is the clearest case of international cooperation. An isolated observatory serves for little. The whole state, of course. They are necessary, yes, every brain cell as necessary: in case of lack of one or another, it does not work properly; all must go together.
And on land, through the sea, thousands of observatories distributed all over the world must, at the same time, be opposed and concentrated in the centers of analysis and prediction. The results of all of them emitted by radio, telegraph or teletype at a speed higher than that of satellites or by telephotography, decoded and synoptically transcribed to work maps, constitute the set of lines, numbers and letters that you see. Let us explain the meaning of the latter.
Isobaras isobaras
You will find them on the maps. They are concentric lines called numbers 1000, 1004, 1008... which appear in many regions. They are almost always numbered with a range of four, although in some Peoples —rarely— they appear with a range of five.
What are isobaras? The word comes from the Greek and means the same pressure. Therefore, it can be thought that these are lines that pass through points of the Earth with the same atmospheric pressure at the time of observations. You may be asked what is the pressure?
The air weighs
When atmospheric pressure is said to be 715 millimeters, what does it mean? That the air weight on a square centimeter of the area is equal to the weight of the mercury column of a section of a square centimeter and a height of 715 millimeters. At sea level and at a temperature of 15 degrees Celsius, when the pressure is 760 millimeters, it is said that there is normal pressure. At other points of different altitude, normal pressure is different; the higher the less air this point has over. And the air, despite its lightness, has weight.
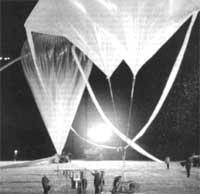
Remember that the hydrogen balloon, even lighter than the air, rises above, as the oil rises on the water.
On the head of a person, an average of 250 kilos of air records.
Milibar Milibar
The measure of atmospheric pressure in millimeters, although they are millimeters of mercury, is curious for several. The millimeter is the international unit of measurement of lengths, not of weight that screams on a surface. Time is similar to measuring the consumed kilo in potatoes, or to measuring the age of a child on a broken shoe wall.
Although the results can be satisfactory, the procedure does not seem the most appropriate. The same occurs with atmospheric pressure. In meteorology the millimeters are maintained mainly by custom. Historical unit, used by the first to measure air pressure, the Italian wise Torricelli. But they are discarding. If you are carriers of the weather map of the TV you will know that the unit used is milibara and that the isobaras are labeled in milibar.
Milibara is the most suitable for measuring atmospheric pressure, since, as required by physicists, it is defined as the force it exerts on a surface unit. More specifically, milibara is the force exerting a dina over a square centimeter.
Another pressure unit used by physicists is the pascal a (Pa). Pascal is the pressure exerted by a newton on an area of one square meter. In spite of the accounts, the milibara is equivalent to 100 Pa, that is, a hectopascal. For this reason, the thousands are also known as hectopascales.
However, as the most common among applied meteorology professionals is that they work in a milibar, we will continue to do so.
The famous 760 mm of normal pressure at sea level are 1013.3 millibars or 1033 grams per square centimeter. As is normal, normal pressure on a mountain is quite lower than 1013.3 MB. Meteorologists have calculated the reduction of atmospheric pressure per meter in height and have extracted a formula. From this, and for the first hundreds of meters from land, it has been possible to affirm that: 8 meters for the pressure to drop by a millet. However, at a higher height it is necessary to cross greater vertical distance to achieve the same pressure reduction: the pressure decreases more and more slowly rising inside the air.
The isobaras are represented at sea level
Returning to our map, you will remember that it was superficial and that this surface was an average sea level.
Let's think there is an observatory on a mountain that marks 996 mb. That is certainly the pressure at this level.
In order for it to be useful in meteorological maps, this isobaric representation data must be modified —it is usually said to be technically reduced—, calculating the pressure that would exist at sea level. Only thus, reduced to the same level (sea level), can the thousands of pressure observations that are made around the world be compared, as can only be compared by reducing fractions to the common denominator.
Without further ado, it should be remembered that we have to reduce all observations of atmospheric pressure to sea level in order to use them in the representation of meteorological maps, regardless of the actual height in which they were made.
The reduction procedure at sea level is to calculate how many millibar should be added to what the barometer marks to compensate that at sea level we have less air than we would have above. The calculation will never be very precise, since between us and the sea level you cannot know if the density of air instead of the mountain would be the same as that of the air that surrounds us. However, we only have the following calculation procedure.
The family of Isoba
For fans of weather map and weather predictions, it's exciting to see a depression born, especially if you've previously announced that birth.
We know that the laws that govern meteorology are true, but it is exciting to predict the formation of a depression that has not yet been born, and to see the next day on the time map and in the place more or less announced. When this process has often been seen, the person comes to love newborn depressions. Some professionals also name the incipient depression they discover: they give her the name of a woman.
Because the more we know the subject, the more we are sure they behave as real living beings, being born and developing as a creature, and sometimes, for their consequences, occupying a great space in the press. Thus we like to see the depressions and other elements of the map; like the living, a little variable, a little feminine, like those depressions called women. The anticyclones are less changing, they are longer lasting, the older brothers who direct the whole.
However, as the daily reality commands, you and we see a lot of Carmen, Luisa or Maria throughout the days in a much more prosaic way on the time maps.
Any of them, the other depressions and the anticyclone brothers who are their sisters, will be for us only isobaras united in a certain way in the time map. That is, a large family of lines. Depending on the size, shape, and position on the map, we can draw conclusions about how long it will take.
Hermanos del Carmen
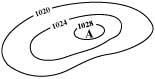
You can see the attached image and set it in the isoba numbering. The isobaras are round, almost circular: 1004, 1008, 1012, 1016,... have numbers inside the outside.
The lowest pressure (1004 millibar in this case) is in the center. What does that mean? A low pressure region is surrounded by others with higher pressure. And that is the portrait of Carmen and all her sisters. That is depression.
As you could have seen in the weather maps, a D is introduced as identification in the center. First letter of the word depression. B is written in Spanish, although as in most of the most recent languages of use it is fashionable to write D. In English L and in German T. Depressions are also called cyclones, although this last word has a reduced meaning.
Look now at the other image: these isobaras are also closed, but the highest value is the interior. The family of lines thus divided is an anticyclone, contrary to depression, that is, a region of high pressure surrounded by others of lower pressure. The initial A of the word anticyclone is known.

Karmen can be considered brothers without problems, and in this way we have taken a further step in the knowledge of a large family that we are still going to expand.
Cousins and cousins of Karmen
Surely you will know that the tassels go with what we say bad weather, and the anticyclones with the good, said in a simplistic way. But many times there are situations of good time and bad weather without anticyclone or closed depression. We speak of cousins and cousins of Karmen.
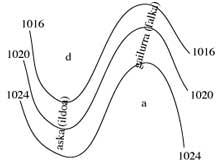
In the image you can see the family of isobaras type V. The inner line is the lower pressure line. It behaves as the lower half of a depression, creating a bad time. Its name is the gulf or water trough at low pressure. Sometimes it is also called a line. On the map it is known with a d to indicate that it is something less than depression.
The opposite case is that of the inverted type U isoba. In it corresponds the highest pressure to the interior line. This configuration is called an anticyclonic wedge or wedge and recalls the upper half of an anticyclone. It is represented with an a on the maps.
With these ideas it will be easy to distinguish the different forms of the pressure zone. This is called technique and commonly called depressions, anticyclones, and other family members.
We have not yet said anything about its nature, but we anticipate that the anticyclones throw air and the depressions absorb. Another so happens with wedges and watering holes.
The isobaric family that we present to you, besides abundant, is one of those that is well arranged: the rich relatives distribute their wealth among the poor (the air), although sometimes it is created affection and fights between them, with the wind of the cholera. On the next page you can see the panorama of the whole family, to facilitate the presence of a single copy as representative of each individual.
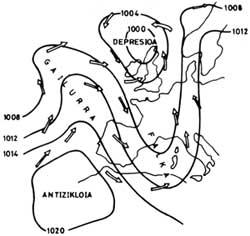
Vials of the air
It is logical to ask how the air of the anticyclones passes to the depressions. The image on the next page appears graphically quite clearly. The arrows indicate the directions of air transport. They do not go in straight line, by the shortest path. The anticyclones divide their flows in a biblical way, transversely, without pride. The wind escapes like surrounding the isobaric lines, it is poured into dissimulation, fulfilling the depression, which is not even learned.
Consequently, the isobaric lines fulfill a function similar to that of the railways of the railroad. Although the wind does not run exactly along the lines, we can think it is so without putting too many legs. The air is driven by the isobaras. And therefore, we have revealed another characteristic of these lines: all points, besides having the same pressure, are also airways. They are therefore wind lines.
We advance in understanding the time map, as you see. If you have read carefully the above, you can perfectly guess the direction of the wind, although no arrow appears on the map. And probably they would have noticed the close relationship between wind and atmospheric pressure, since both are represented on the same lines.
But, on the other hand, depending on whether these lines are narrow or wide, the wind force can also be extracted and meteorologists pull it out that way. The more united it is, the more wind it is and vice versa.
Watch Needles Watch Needles
As for the circulation of winds in depressions and anticyclones, it is evident that in the northern hemisphere, the low pressures are always on the left of the route, unlike in the southern hemisphere. We will see why, but now you can deduce in the light of the previous rule that the winds of the northern hemisphere circulate in the same direction as the clocks around the anticyclones and in the reverse direction in the depressions. In the southern hemisphere, the circulation of the wind is contrary: against the clock needles, in anticyclones and in favor, in depressions. Thus, it explains why the arrows that usually appear in the time maps of the television on the isoba. In the meteorological centers, in the professional maps of work no arrow of this type is represented.
Rationalist lines on the map
We still have more stripes on the map. They are those yellowish lines that frequently appear on meteorological maps, some dotted and others with a certain belly. They seem to have a lot of influence to decide whether they will do good or bad weather. You will have already imagined that I am not speaking in front. The term front is used by anyone: comes a rain front..., a cold front approaches... Everyone thinks of the concept that the front is the cause of bad time.
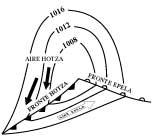
What is really the front? Perhaps this question has its origin in: Where does that enormous energy come from which they show depressions? The answers to these questions will not be analyzed at this time, since we only want to present an overview of the weather map. But we will tell you that in a depression there is not normally a single type of air, but a type of air i of very different origin and with different characteristics and properties. These kinds of air are not mixed, but they are together (one is hot and another cold). The energy of depression arises from the contrast between both. It is like a thermal power plant of electrical generation. This energy appears as wind, rain, storm, etc.
The limit that separates the temperate air that advances from the cold that is withdrawing is a warm front. The one that separates the vanguard of cold air from that of the temperate, is the cold front.
In single color weather maps, the warm front is represented by a line with small lilies and the cold front with sharp teeth. In color maps, such as normative maps of weather services, hot fronts are represented with red and cold blue lines.
The cold front usually goes faster than the heat, arriving on many occasions to catch the second. In the maps are drawn then at a time, alternating sharp and wise teeth; or if it is color, the line is painted purple (mix of blue and red). Thus produced fronts are called occluded fronts or occlusions and have common properties, acting as a hot and cold front mixture. But later will come the complete explanation of these atmospheric disorders. For the moment, just what has been said.
This is only the beginning
Both reader and reader, with the above, you can understand the concepts that appear in meteorological programs. If you want to delve into each concept, we recommend that you read the book mentioned at the beginning of this article.
In summary, the essential elements of a weather map are isobaras and fronts. Know how to combine the rest, have a little imagination and deepen a little more in the knowledge of the air that surrounds us.
Buletina
Bidali zure helbide elektronikoa eta jaso asteroko buletina zure sarrera-ontzian