

Maps
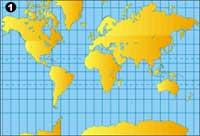
The reason for the first and second response is related to the first map. Our visual experience gives us an answer and that is based on the first map, as it is the first map in our studios and outside it the map we have seen most. The second map we have seen rarely and that is why we are surprised. However, both maps are correct.
Where is the key? We will try to explain it. Maps are flat images of land or plots. How can the earth (sphere) be converted into a laun (plane)? What properties are preserved in this conversion? To name three, are lengths (distances), angles and surfaces preserved? In that is the key, the earth is round (sphere) and the maps are launas (planes)?
This conversion is done by cartographic projections. Cartographic projection is the result of passing the points of a spherical surface (sphere) or a part of it to a laun surface (plane). The metric particularities of the sphere and plane make it impossible to convert without distortion. Cartographers have been inventing and using different procedures to represent the earth on a plane for some time. However, if moving from the sphere to the plane they maintain distances, angles and surfaces are distorted. And if surfaces are accurately expressed, shapes, angles and distances are pressed. Therefore, if you want to make a map you have to prioritize something.
If the projection hides lengths (distances) is called equidistant, if the angles are respected we have a good projection and if you save the surfaces is called equivalent projection. On the other hand, there are intermediate projections that tend to the intersection between two or three properties, which are not equidistant, conforming or equivalent.

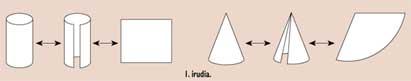
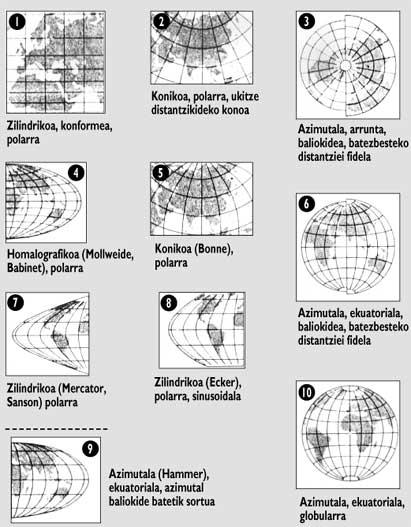
But how is conversion, projection done? There are many ways to do this. Let's look ahead to the idea that will help us later (Figure 1). If you take a cylinder and cut and open or expand from top to bottom by a straight line, you will get a piece of plane. On the contrary, by taking a sheet, you can form a cylinder by rounded it in the form of a tube. Take now a cone, cut through a straight line that passes through the vertex and open it, again you will get a piece of plane. If you try to do the same with the sphere you will not get the same result. The cylinder and cone are said to be transparent surfaces, but the sphere is not a transparent surface.
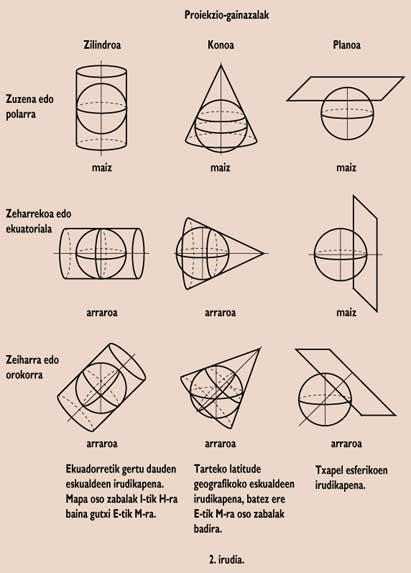
If we consider this idea, we will have three possibilities of making a map: a) moving from the sphere to the cylinder and from the cylinder to the plane, cylindrical projection; b) moving from the sphere to the cone and from the cone to the plane, conical projection; c) moving from the sphere to the plane, acimoutal projection.
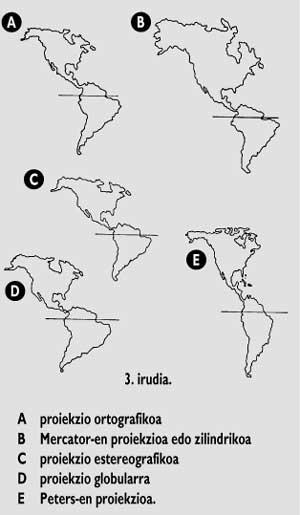
The projection can be done by parallel lines or by straight lines passing through a point. In the first, the lines can be aligned with the projection plane (orthogonal projection) or oblique (oblique projection). In the second, the intersection point of the lines can be the center of the sphere (central or gnomic projection); or it can be on the surface of the sphere (stereographic projection); or it can be on the infinite (spelling projection) (Figures 3 and 4).
The first map used the central cylindrical projection, the projection of Mercator. This projection increases the surfaces near the poles, on the other hand, retains the angles in small regions, but curves the long routes (planes, ships,...).
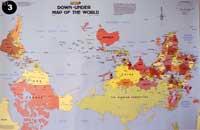
The second map used the projection that houses the surfaces, the projection of Peters. Distortion of angles and distances. Finally, we want to ask a question about the use made and the cartographic projection. The difference between the first and the second map is evident, although the first one is used in more than a second. And looking at the third map, considering that the earth is in space, the third map is also correct, although it is not used either.
Political and psychological factors gain strength in this use. It is good for those of us who live in these great peoples of the North to live there, in those small towns below. What does our country have to do in the north and bigger than the rest? Or, mixing the second and third map, what influence would it have on our life if we could see our people in the south and smaller than the rest?
Note: Africa has an area of 30.300,000 km 2. The surface of Siberia is 12.765.000 km 2.
Buletina
Bidali zure helbide elektronikoa eta jaso asteroko buletina zure sarrera-ontzian