
Earth ray map
2002/01/30 Elhuyar Zientzia
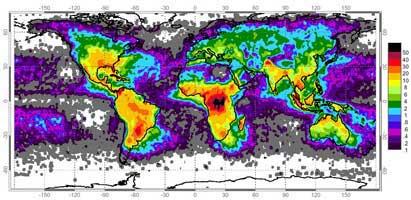
NASA scientists have developed a map based on the distribution of rays and have seen how they change both in latitude and altitude. The colors shown on the top map indicate the average number of rays per square kilometer and place of the year.
Ray data has been obtained by two optical detectors: Optical Transient Detector (OTD) and Lightening Imaging Sensor (LIS). The first was launched in April 1995 and has worked for five years. The second, which was launched in 1997 along with a satellite to measure rainfall in the tropics, is still in operation. However, the map has been completed with data collected until March 2000.
These detectors use high-speed cameras to detect changes occurring at the top of the clouds, which the human eye cannot observe, and have been able to obtain very accurate information.
Despite the fact that lightning measurements were carried out through radio frequencies before the commissioning of these detectors, from the ground, and despite the good results obtained in small areas, the data obtained in the oceans and sparsely populated regions were scarce.
The new map has shown which ones are in the busiest area. In the top positions are Florida, Himalaya and Central Africa. However, in the Arctic and Antarctic there are hardly any rays. In the oceans, activity is also low, according to researchers, because the sea surface is not as hot as the land surface.

Gai honi buruzko eduki gehiago
Elhuyarrek garatutako teknologia