Statistics and truth
There are many who mix statistics with statistics. Statistics is a branch of mathematics charged with collecting, organizing, and analyzing numerical data. And not only that, but it helps us to solve the problems and make decisions that arise in the design of the experiments. Despite its short history as a scientific discipline, it has a long antiquity as a tool for synthesizing and publishing numerical information. The extension of statistics and its instrumental function extends to all branches of science.
In cases where no data is available on all elements of the study population, it will be worked in conditions of uncertainty and randomness to prepare the conclusions. In these cases, the inferential analysis of the data uses a statistical methodology to estimate unknown parameters, contrast concrete hypotheses, foresee future behaviors, make decisions, perform individual and collective diagnoses, quantify uncertainty and even limit the margin of error. Thus is announced the time, the state of health of a person, the comparison between the results of both procedures, the reliability of the components of a machine over several years. The specific forecasts should be: tomorrow there is a probability of rain of 87%, you have the brain badly with a 93% probability, or the bulb A is better than the B with a margin of error of 5%. But it does not seem that the man of time, neither the doctor, nor the seller of bulbs take the task of determining the degree of error of their forecasts.
It should be noted, moreover, that notions of madness and uncertainty sometimes confuse intuition. Thus, in a group of 30 people, the probability that there are two people who meet the years on the same day is higher than that of not existing, that is, more than 50%. With only thirty people it seems a lie, but the theory of probability "proves" that the probability that the birthday will occur at a time is greater than the probability that it will not occur at a time.
A process of inferential analysis of data leads to the definition of the population, the determination of the size of the sample and the selection of the elements, the measurement of the variables of the object of study, the analysis of the data and the presentation of the results. In each of these stages we can make mistakes, which in some cases are difficult to quantify. The objective of statistical inference will be to quantify the probability of each possible error. However, as they can be lied with language, with numbers can also be lied, manipulating the results, dividing the information, keeping a part in the back pocket, or presenting the results fraudulently...
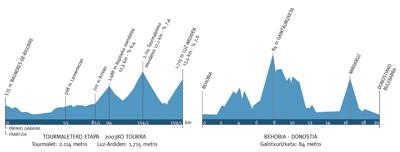
Let's see two quite naive examples. In the two attached charts, the profiles of two races with great continuity in the Basque Country are shown. In one of them, on the Tour de France there are several mountain ports that cyclists climb along 159.5 kilometers, including Tourmalet --2.114 meters high. The other graph corresponds to the race Behobia-San Sebastián. In this race, the runners join the two villages, running approximately 20 kilometers. It is basically a flat route with the highest heights, Gaintxurizketa, with 84 meters. See the profiles that appear in the two charts: they are similar. The scales used to create graphics are very different, but they have allowed me to design two very similar profiles. Very different data but same graphics. Examples can also be seen against every day.
Let's go now to Oñati. To see that it is a village is known. But in the magazine Concelupetik (published in Oñati), explaining the number of visitors of the municipality in 2007, a small error appears.
To begin with, what surprises is the accuracy of the headline: "20,293 tourists visited Oñati in 2007". Doubts and questions arise about this. Do all those who turn around the university count? And all those who come to the day of the Corpus? And all those who go to Arantzazu? And all those who go to the caves of Arrikrutz? How do they manage to count all with this type of precision? Being so beautiful Oñati and with so many tourists, are not few? Average lower than 60 per day.
After reading the news, our doubts are clarified: 20.293 people pass through the tourist office. The title mixes both concepts: sample and statistical population. Unfortunately, this type of errors are made with a very high frequency in the presentations of statistical results.

Statistics is a tool that helps to know the “truth” of a reality and invades us in different areas of life. However, misuse and statistical excesses sometimes justify the statistical reticence of a part of the population. The only vaccine against this misuse is the highest statistical training.
I think it is time to claim the inclusion of more statistical concepts in the school curriculum of mathematics. Statistics for life, or something similar... Or, well, why not Mathematics for Life? It would help reduce "social annumerism" and, with it, would help us to be alert to the bad uses of statistics. And it is that, although the numbers do not lie, the liars are eleven.
Juanito Etxeberria Murgiondo. Professor of the UPV. Department of Research and Diagnostic Methods in Education.
Buletina
Bidali zure helbide elektronikoa eta jaso asteroko buletina zure sarrera-ontzian


