

Landsat-7, the faithful guardian of the Earth
Prior to 1972 satellite observations were used successfully in meteorology, but the study of Earth's surface phenomena and characteristics was an area not cultivated by satellite. NASA took the first step when it launched the Landsat program. The success of the program was total: it totally changed the way we look at our planet and with it a new field of scientific research and practical applications was launched: remote sensing.
Landsat family
In 1972 the Landsat-1 satellite left California. He had a 75-m resolution multispectral scanner (MSS) and worked until January 2, 1978. The images sent by Landsat-1 clearly showed that remote sensing was a very suitable tool in geology, land management, water resource planning, sea ice movement or mapping. In his five and a half years of life he sent more than 300,000 photographs. The success of the first Landsat satellite was a stimulus for the development and improvement of the program.
Landsat-2 followed. He was expelled in 1975 and took photographs until February 1982. The following, Landsat 3, worked from 31 March 1978 to 31 March 1983.
Landsat-4 was spaced on 22 July 1982, with an orbit lower than its predecessors and in addition to the MSS scanner used in the previous three, it carried a thematic map tool (Thematic Mapper, TM). While the MSS works in 4 spectral bands, the TM works in 7 spectral bands, one of which detects infrared radiation (heat) and therefore can take nocturnal photos. Thanks to the TM, Landsat-4 sent more detailed and clear data than the previous ones. He worked until July 1987.
Landsat-5 was spaced in 1984 and settled in an orbit lower than Landsat-4. As for the tooling, it was like the previous one. The next, Landsat-6, designed to continue the program, was equipped with more powerful tools than the previous ones. It took off on October 5, 1993, but was an error in the launch and failed to reach the orbit. It was wasted. However, the observations were not interrupted, as Landsat-5 continued to work.
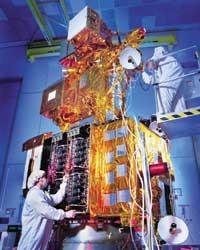
The last child of the Landsat-7 family, who has been working since April of this year, has an improved thematic mapper (ETM+), which works in 8 spectral bands and with a resolution higher than the previous ones.
Landsat images for what?
Since 1972 and without interruption, the Landsat program has made available to researchers a lot of data and images. This data is a unique treasure. Currently, to analyze any planetary change, Landsat data is essential for its quality and quantity. The surface of the Earth is the expression of biophysical and cultural processes, so the surface data of the Earth serves to measure its extent.
Landsat's historical data provides information on the variation in the extension of a process and the speed of its modification. For this reason, Landsat data are fundamental for understanding the influence and distribution of global phenomena in the research of regional processes. This data has been used and will be used for the study of many areas. For example, the study of the condition of urbanization in rural areas or the modelling of phenomena affecting the global environment (such as the distribution of snow and ice, which affects climate change) and the study of atmospheric phenomena are also very useful in these phenomena when surface processes of the Earth affect these phenomena.
How many examples
There are many examples of use. For example, information on failures and breakage zones obtained from Landsat images has been used to select the location of nuclear power plants and choose the most suitable pipeline and pipeline routes. And satellite images have been used to support navigation in Alaska or to monitor pollution of Osaka Bay in Japan.
Geographers also use Landsat images. In Antarctica the images of Landsat discovered in the south of the Victoria Province and in the glacier Lambert mountain groups hitherto unknown.

Satellite images can also be used to identify and measure water resources. For example, they can be used to measure the amount of snow accumulated in winter in the mountains and thereby predict how much the flow of rivers will vary in spring when snow melts. In
other respects, the Landsat images show very clearly the type and distribution of ocean ice, as well as the growth, movement and rupture of sea ice. This allows to show ports without ice or roads without ice in icy areas of the sea. In 1975 the usefulness of the Landsat satellite for navigation was clearly demonstrated: American icebreaker Burton Island was on a scientific expedition in Antarctica. One day he was trapped in the ice and guided by narrow channels of water that could only be seen in the Landsat images until he left the ice zone.
Telesensing and Landsat applications have been proven today suitable and useful for all these programs.
How does Landsat work?
Landsat distributes the data in the Worlwide Reference System (WRS) boxes. In this system of reference the entire surface of the Earth is divided into squares, that is, in orbital routes -in pistes- and in lines. The north-south tracks are numbered from 001 to 233 from east to west, with the 001 track that crosses the equator in a western length of 64.60 degrees.
The separations between the 248 east-west lines are also uniform: on the day side line 60 and on the night side line 184 join the equator. Thus, the WRS system divides the Earth's surface into 57,784 grids. Each grid has a width of 183 km and a length of 170 km. Based on the WRS, the satellite has a 16-day cycle, that is, for 16 days it reaches the entire Earth's surface or, which is the same, the satellite passes every 16 days above any place.
The ETM+ scanner gets 3.8 gigabit information per grid. This data can be sent in real time via an X-ray band of 150 megabites per second to Landsat Ground Central Station, located in Sioux Falls, South Dakota, USA, or to one of the international stations that track the Landsat satellite on Earth. Or, they can be stored in a pointer solid state recorder with the capacity to store information of 380 gigabits (100 boxes of information) for subsequent shipment to Earth.
In addition, the satellite has the second communication route with the Earth, the short wave band (band S), used to receive orders from satellite government and send telemetry data.
Creating images from Landsat data
The Landsat mapping scanner detects the sunlight reflected by the Earth in the entire range of the electromagnetic spectrum that our eye sees, that is, from blue to red, and also detects the infrared radiation that our eye cannot see but
reflects the Earth (A).
The most common way to create images from the data sent by the Landsat scanner is to use a primary color band to get a color image (B) by combining it with other bands. In Figure C, the figure resulting from the union of bands 4 and 2 shows the figure "natural color" that is obtained by the union of the three bands of visible light (3rd, 2nd and 1st).
Monitoring deforestation
In these images you can see part of the Amazon rainforest between the Brazilian states of Tocantins, Mahanhao and Para. The photo on the left was taken in August 1995 and on the right in May 1997. Within 2 years, a large part of the forest was squeezed.
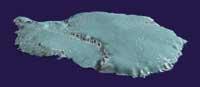
Stereo projections for three-dimensional images
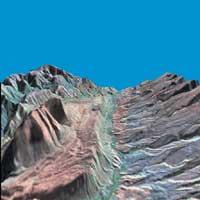
This image is a perspective of the Camargo synclinal in central Bolivia. The creation of the image was based on two real images of the satellite Landsat-5, made on June 6, 1985 and June 16, 1986.
Landsat caught them from slightly different angles. The two different positions of the satellite act like our two eyes, as our eyes are within walking distance. Combining both images with a territorial model can obtain stereo images.
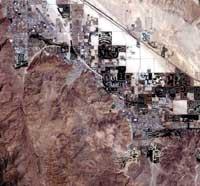
Terrain relief in detail
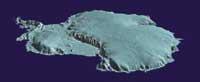
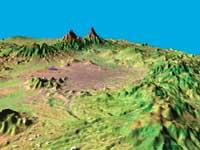
Image of the region near Mexico City, obtained from data sent by Landsat (combination of three bands: short-wave infrared, infrared and green light). It looks very well the mountainous and abrupt territory that surrounds the city. This situation causes the urban air not to come out, stop, stop and smog. The city has been built on the terrain formed by the erosion of the mountains, that is, the buildings and structures of the city rest on sedimentary rocks. Consequently, buildings do not have a solid foundation and earthquakes can cause serious disasters in the city.
Measuring the extent and change of glaciers
Researchers study the movement and behavior of ice in Antarctica. If the forces that cause the movement of ice change, the ice could fly faster off the continent and fall to the sea, raising the sea level.
The study of movement from Earth is not easy, as the Antarctic climate does not allow sufficient observations and measurements.
Geologists and hydrologists are using Landsat images to measure movement and use crevasses as a reference point. With this data, along with other references and data, you can see in the images the appearance of Antarctica 20,000 years ago (in the last ice) and the current one.
The combination of scanner bands allows highlighting some features
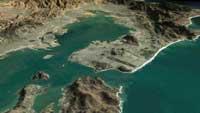
In these images you can see a region of southern California, from Long Beach to San Diego. The same image appears on the left and right; figure 3 appears on the left. (red), 2. (green) and 1. (red) is a combination of bands, very similar to natural color. However, golf courses manifest much more if you use band 4 (band near the infrared), which is the one that best reflects chlorophyll. The green grass of the fields
appears in bright red in the image on the right that uses the combination of 4-3-2 bands.
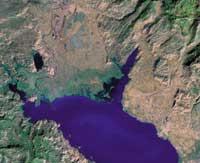
Working tool of Landsat cartographers
Landsat
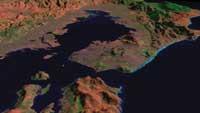
images can also be used in cartography. In this picture you can see Lake Scutari (in the center) between Albania (on the right) and Montenegro. At the top of the center of the image you can also see the city of Podgorica.
Buletina
Bidali zure helbide elektronikoa eta jaso asteroko buletina zure sarrera-ontzian