

Observation techniques in the darkness of the galaxy
Speaking of the structure and singularity of the French Way and spiral galaxies, we have explained the experimental bases of theories and techniques to achieve them, even if it is very superficial. It may be interesting to collect this scattered information and add some detail to make the topic clearer. In that we will try this time.
When talking about galaxies in general, astrophysicists show their conformity with the nature of their components, but when determining the percentage of components the numbers are quite different, especially due to the different assessments of dark matter (or lost). Joining the case of our galaxy, it may be easier to reach an agreement.
The composition of the French Way could be approximately 75% of the matter would be composed of stars and the other 25% by interstellar matter. The latter, like stars, would consist of hydrogen (around 90%), helium (around 10%) and other elements and compounds (less than 1%). 1% low contains interstellar dust that prevents the propagation of optical radiation.
We should also mention the different situations in which hydrogen can occur when it is open in stars. Under normal density conditions of interstellar cold space, hydrogen is atomic and forms clouds called HI. This hydrogen emits a radiation of 21 cm as known as the radio. For any reason, when the atomic hydrogen of a region contracts, the increase in density facilitates the formation of H 2 molecules by forming molecular hydrogen clouds. Molecular hydrogen lacks spectral lines in the field of radio waves. Therefore, it cannot be detected directly through radio telescopes. However, as indicated in the previous number, it can be seen by the appearance of carbon monoxide (CO) molecules. The latter, like others, are formed when H 2 are formed and are the most abundant after hydrogen.
If carbon monoxide molecules do not interact with those in the environment, they are left without emitting energy at their lowest energy level. However, in molecular clouds there are many collisions with hydrogen molecules. Therefore, they are in an excited state and the surplus energy emits it by photons. The wavelength of the normal emission is 2.6 millimeters. It corresponds to the energy difference between the first energy level and the lowest rotation movement, measurable through radio telescopes.
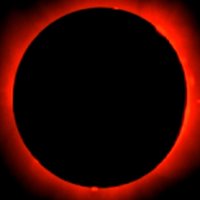
Finally, hydrogen can also appear in ionized state, that is, lost its electron. Ionization occurs in the vicinity of the stars, due to its ultraviolet radiation. Ionized hydrogen clouds are called H II clouds and emit auditory band radiation.
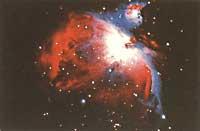
Of course, the first study sessions of our galaxy were conducted using optical telescopes, observing planetary nebulae, regions H II and star sets of spectral classes 0 and B. Of these objects only a few are those outside the Solar System environment, in rare directions where dust does not disturb. His studies gave the first traces of the structure of the arms of galaxies around the Sun. However, few clues.
In 1951 the 21 cm line was discovered that highlights the clouds of H I, beginning a new era in the study of the galaxy structures. The intensity of the aforementioned line can be considered as the measure of atomic hydrogen in the direction of the space being explored. On the other hand, by precise measurement of the emission frequency, the radial velocity of hydrogen (in the direction of the eye line) can be measured by the Doppler effect. In addition, the measure of speed allows us to differentiate the different clouds in the same direction: being different clouds, the movements will also be different and the radial speeds, which materialize in different displacements to red or blue. This pathway, however, cannot be used in the direction of the center of the galaxy or in its opposite direction (direction of the anticenter). Since in these cases the velocity of matter is practically associated with the direction of observation, radial velocity is almost zero regardless of distance.
Despite not avoiding the difficulty we have just mentioned, the finding of a molecular hydrogen detection method that has been described above has meant a significant advance in the construction of the galaxi map. On the one hand, these clouds are regions of compression. Therefore, they are directly related to the arms. On the other hand, they have a great advantage over atomic hydrogen, which is much more widespread in space and which is almost impossible to delimit and separate clouds.
Molecular hydrogen is due to its accumulation in higher density clouds. This facilitates the delimitation of clouds. Finally, it should be noted that only half of the interstellar matter, which accounts for 25% of the mass of the galaxy, is atomic hydrogen. The other half passes, it is molecular. Therefore, the study of molecular hydrogen covers a large vacuum.
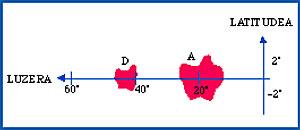
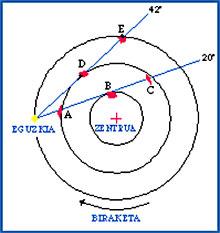
Finally, we will try to explain more specifically the use of measured radial velocity to differentiate and locate the different clouds. The results obtained from the measurement of the position and radial velocity of a cloud are presented in two two-dimensional diagrams. In one, length and galactic latitudes on the axes. On the other, galactic length and radial velocity. For example, the molecular clouds represented in Figure 1: E, in the same orbit of the Sun and four other internal orbits in two. If the observations are made in the two directions drawn in the image, the graph that gives us the position of the clouds is the one that appears in figure 2. The closest clouds cover the others. In the graphic length/speed they are distinguished by different radial speeds.
The orbital speed of a cloud depends on the radius of the orbit and the mass of matter within its limits. Normally the speeds are higher the lower the radius of the orbits. Therefore, if in Figure 1 we take any of the two directions of observation, the greater of the radial velocities that we measure will be that corresponding to the cloud located in the tangential orbit to this direction of observation. On the one hand, because it is the innermost orbit and on the other, because the radial velocity is the same as that of the cloud.
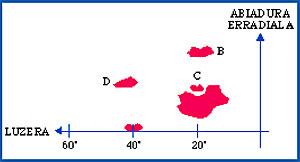
If we take symmetrical points on both sides of this point (A and C, for example, with respect to B), the radial velocities will be similar but lower than those of B (see figure 3) and the points will also be in the same orbit. With the data taken in different directions we can construct the turn curve, that is, the variation curve of the orbital speed. Once this is known, when we make observations in a given direction, we can calculate the radius of the orbit by measuring the radial velocity.
We still have another differentiation. With our method we have concluded that clouds A and C move approximately in the same orbit, but which is closest to the Sun? If we cannot relate the cloud to another known object, other ways are used such as measuring the width of the spectral line. Small clouds often have narrow lines, as the range of inner motion is also narrow. In the case of large clouds, however, the stripes are wide because the differences between component speeds are also greater. Therefore, if the observed cloud lines are narrow, it is almost certain that we have the small cloud on the nearest side.
EPHEMERISSUN : July 23 at 8h 11min enters Leo
PLANETS
|
Buletina
Bidali zure helbide elektronikoa eta jaso asteroko buletina zure sarrera-ontzian